Introduction
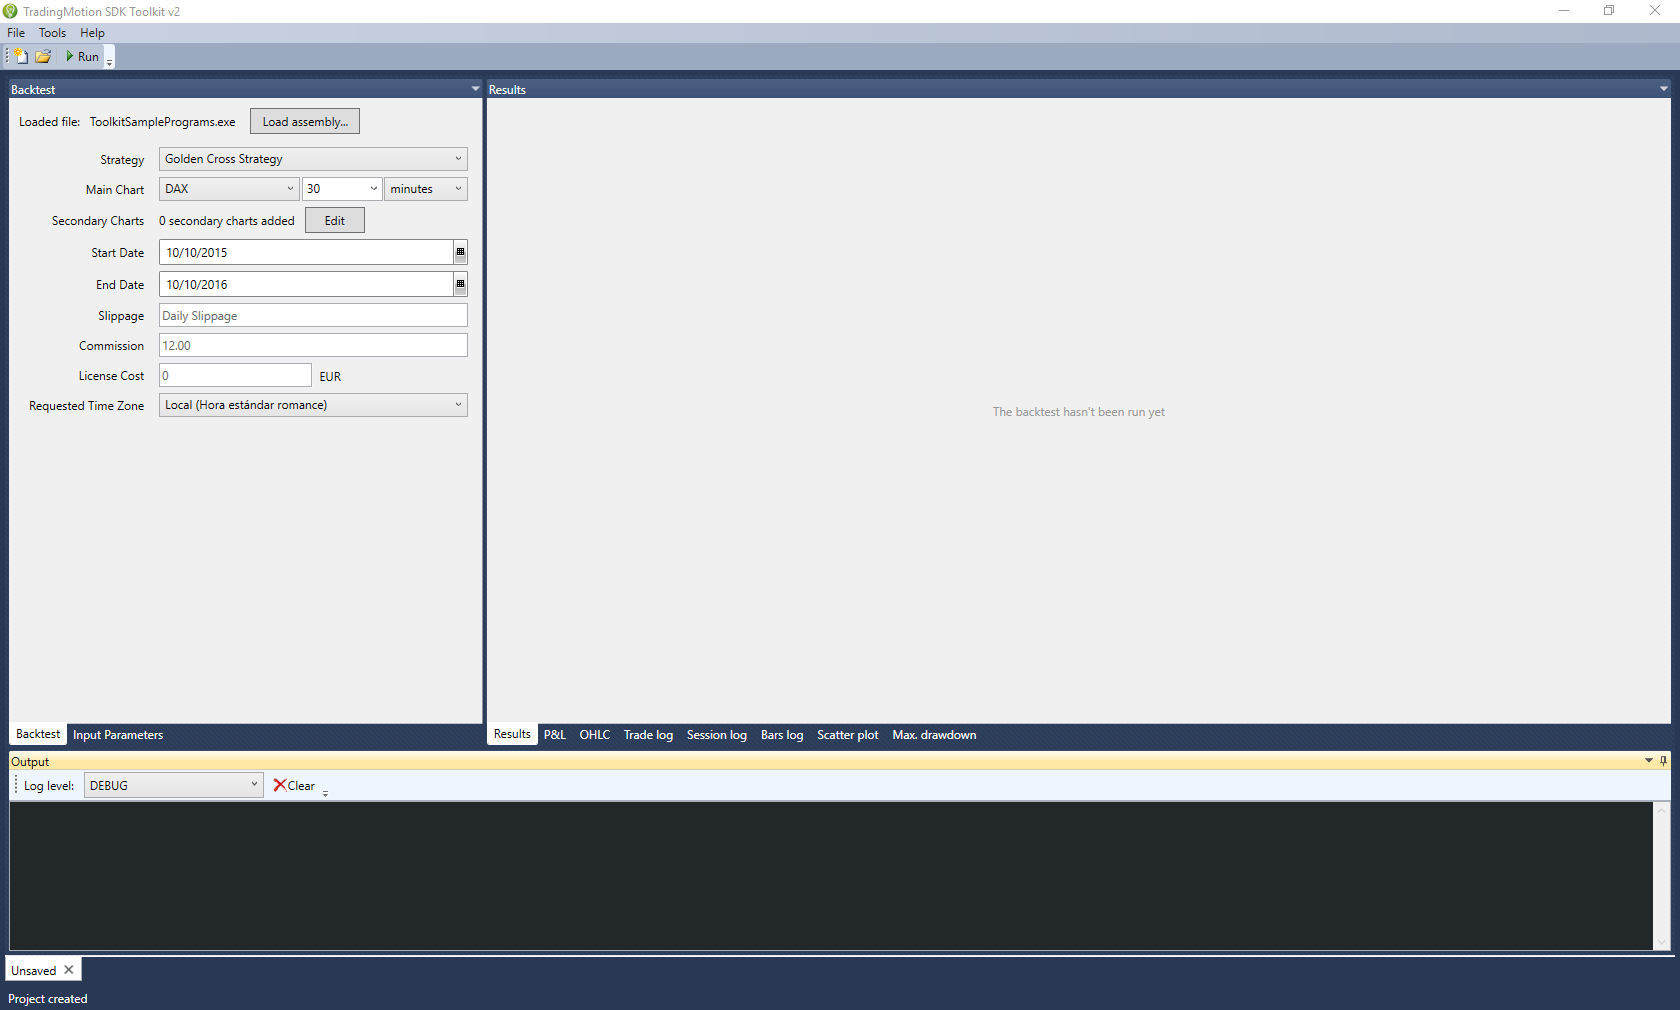
TradingMotion SDK Toolkit v2 is a new version of our Windows application to perform backtests and optimizations of your strategies. We have completely redesigned the user interface and added new features and improvements.
Please, take note that our API is NOT compatible with strategies created for the first version of the Toolkit v1. Read the section Importing strategies from v1 to v2 to learn how to migrate your current strategies to the new v2 API.
Some of the new most important features of this version:
- The user will work with 2 types of project: backtest and optimization.
- Projects can be saved to your computer in the format *.tmproj, so that your don’t need to create a project every time you open the Toolkit v2.
Backtest Project
Project to test a strategy in historical periods, that will tell us how our strategy behaves in the past.
Optimizer Project
Project to optimize the parameters of a strategy.
A strategy that uses parameters is capable of being optimized (optimization is only possible for strategies that have external parameters). This process allows to search and select the best values for the parameters using the strategy in a specific history, and thus, obtain maximum performance.
Installing
We execute the installer TradingMotionSDKv2Installer.msi
We click on Next, it will show on screen the Software License Terms of TradingMotion Toolkit SDK v2. These terms represent a contract between the user and TradingMotion. You should read the contract carefully and, if you want to continue installation, accept the terms by checking on the appropriate box and then Next.
After accepting the previous agreement you will need to select the directory where to install the software.
After selecting the directory where to install the software click on Install.
Toolkit v2 installation begins. This process can take several minutes depending on the computer.
This completes the installation process and the Toolkit v2 is ready for use.
After installation the following window to include templates in Visual Studio appears. Select the Visual Studios that want to add templates to and press Install.
Now we have installed the templates in the Visual Studios previously selected.
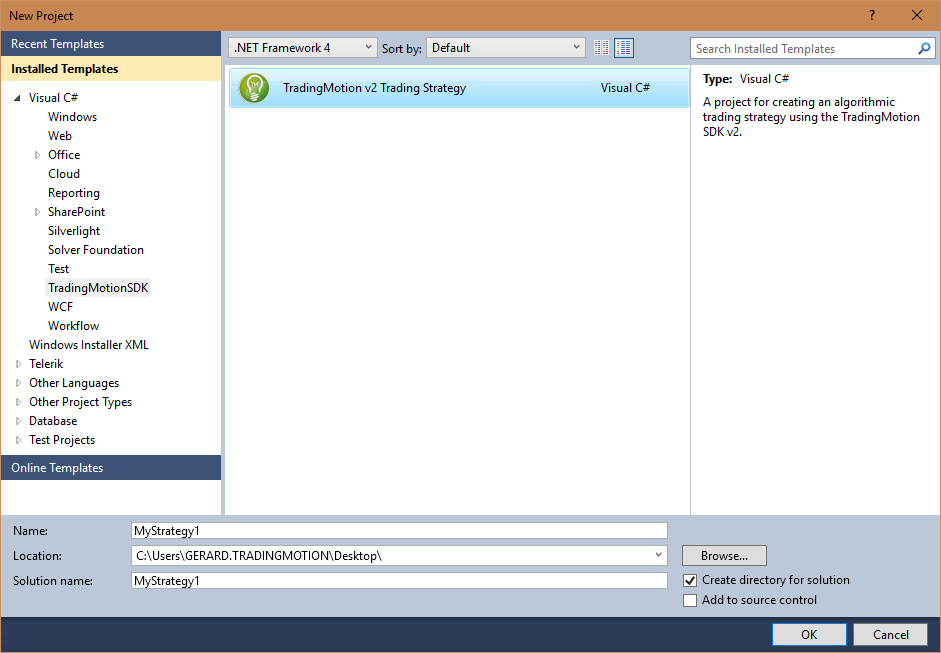
If we open the Visual Studio → New Project we can see that the templates already appear to program strategies with TradingMotion SDKv2.
Getting Started
The first time you open the toolkit it will ask for the username and password that you have previously obtained through registration, fill the username and password fields and press Login.
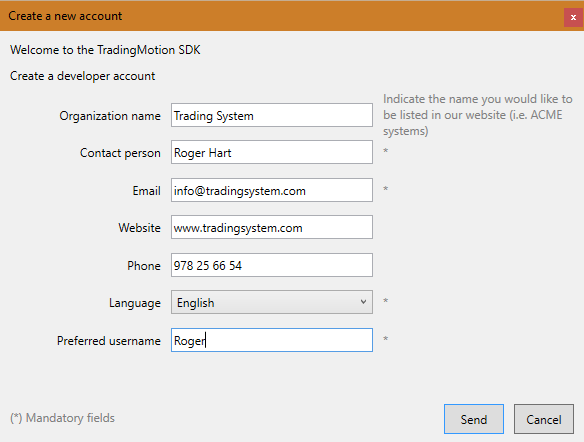
If you do not already have a developer TradingMotion user, click at the bottom right on "Create new account". A window will open with a registration form, fill in the required fields and click "Submit". After submitting the registration form, you will receive an email with the username and password.
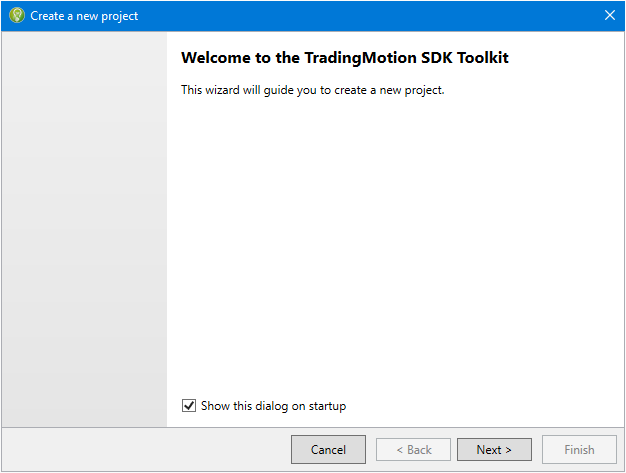
Once logged in, the toolkit opens and the dialog "Create a new project" is displayed, this dialogue is a wizard that will help us create Backtest / Optimizer projects quickly and easily. To create a new project see Backtest Project / Optimizer Project sections.
Backtest Project
To create a Backtest project start the Toolkit v2, once opened the dialogue "Create a new project" will appear (if the dialog does not appear go to the top menu File →New → Project) we click Next.
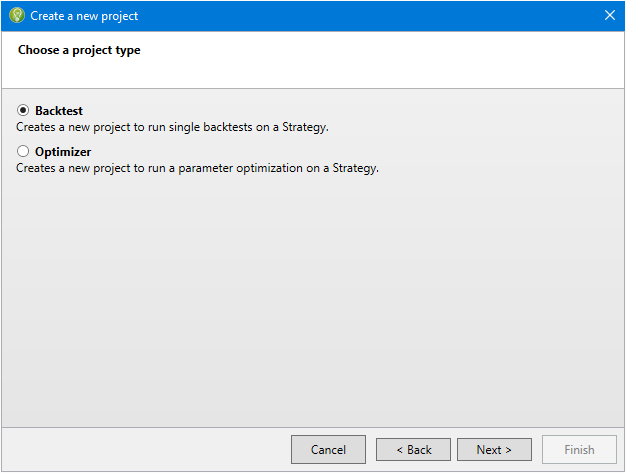
After clicking Next we have two options for creating a project:
- Backtest
- Optimizador
We select the Backtest option and click on Next.
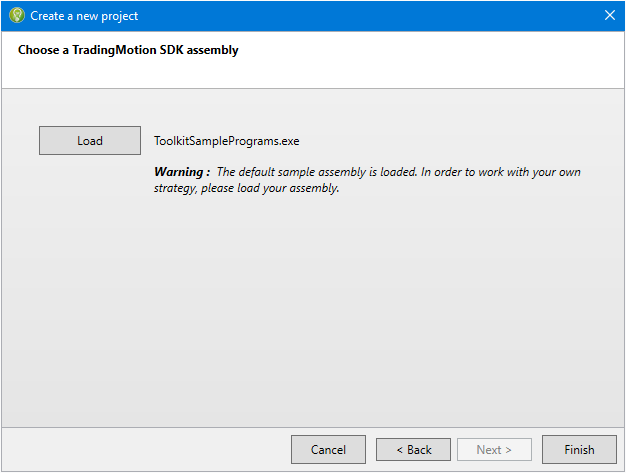
Once we have chosen the Backtest project we need to load the assembly that we have previously generated with the SDKv2 of TradingMotion (we can see that by default the Toolkit v2 comes with an assembly example). We click on Load and look for the assembly of the strategy we want to create the project Backtest for, and once selected, press Finish.
The Backtest project is created and we can start working with it.
Tabs for Backtest Project
A continuación se describen las diferentes partes de la interfície de un proyecto Backtest.
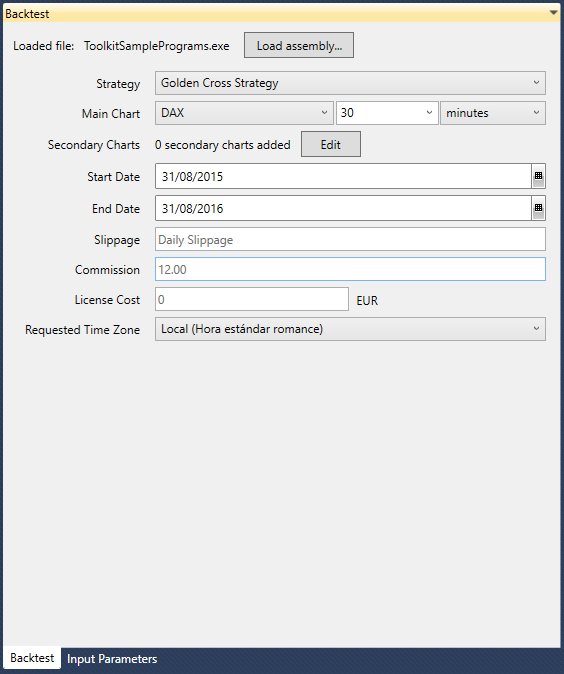
Backtest
- Loaded File: Assembly containing the strategy coded with TradingMotion SDKv2.
- Strategy: Strategies included in the binary file.
- Main Chart: Product on which the backtest, size of the bars and the unit of time (minutes or days) will be held.
- Secondary Charts: Secondary charts that the strategy may use.
- Start Date: Start date of the backtest.
- End Date: End date of the backtest.
- Slippage: Slippage is the difference between the price at which theoretically a system should have been executed and the price it has actually executed in the market. By default you will see the average slippage for each combination of symbols / day we are simulating.
- Commission: We can specify a fixed amount for each contract of the strategy. By default you will see the real commission marked by the FCM.
- Licence Cost: Monthly license price the developer will charge his customers. The default is 0 (free).
- Time Zone: The start and end dates of the backtest are in the time zone specified by the user. Bars reach the strategy in the same time zone.
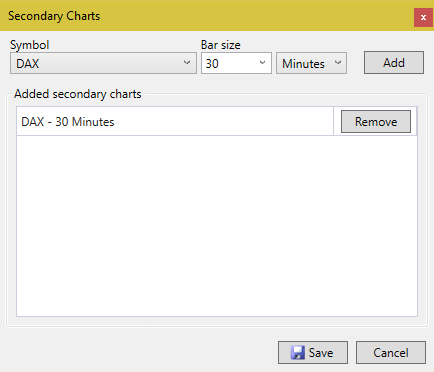
To add secondary charts click on the Edit button and the following screen will appear:
We choose the symbol, compression and unit of time (minutes or days), press Add and it will appear on the list of added charts. We can add the charts we want, and once added click Save.
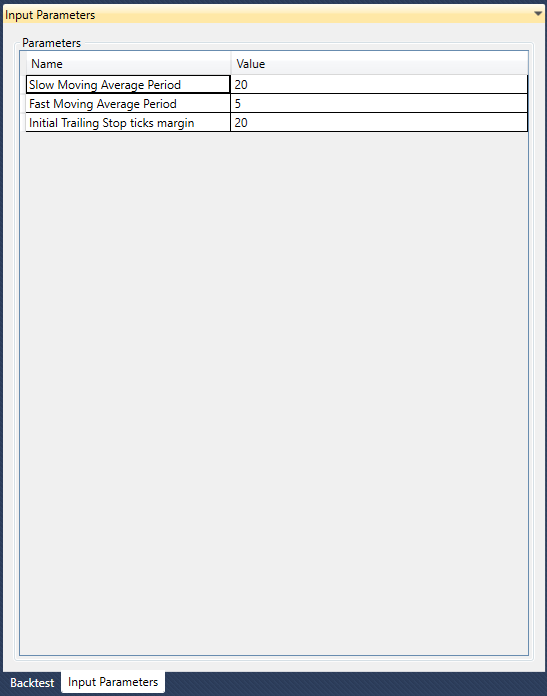
Input Parameters
Here are the parameters we have exposed when we programmed our strategy, we can change their values if necessary.
Results
As we can see the first set of results is a summary of the configuration that we have indicated in the backtest tab. The second section gives more detailed information on the results of our strategy.
- Net P&L: The absolute profit or loss over the analyzed time range, commission, slippage and license costs free.
- Profit Factor:The relation between profits and losses, calculated dividing the sum of profits and the sum of losses.
- Sharpe ratio: The excess of output per deviation unit. It’s characterized by how well the profitability of an asset compensates the investor for the taken risk. When comparing two assets to a common reference point, the asset with a higher Sharpe ratio offers a better return given the same risk.
- Analyzed Sessions:The number of analyzed sessions in the period, i.e. the days when the traded market has been open, and the strategy has been calculated over the official data of those days.
- Annual ROI: The total return divided by the number of years in the period (total return = net profit/loss divided by suggested capital).
- Commission per side: The commission applied in each trade.
- Slippage per side: The difference between execution price indicated by the trading platform, and the price the trade actually executes at in real accounts. Non live performance is adjusted downwards by a slippage estimate based on the average slippage amount seen in the same contract traded by real clients on other systems.
- Net P&L over Drawdown:Risk based measure that indicates the relation between the winnings of our system and the drawdown. For example, a Net P&L over Drawdown of 1.5 indicates us that for each 1000€ of losses we will have 1500€ of winnings.
- Math expectation: This mathematical ratio indicates any time the mathematical expectancy of success using the strategy.
- Winning Sessions: The number of trading sessions in the period with returns greater than 0.
- Winning Sessions average: The average return across all winning sessions.
- Losing Sessions: The number of trading sessions in the period with returns lower than 0.
- Losing Sessions average: The average return across all losing sessions.
- Worst drawdown: The worst peak to valley loss of the system, as measured on an end of session basis, with the date of the low point listed.
- Best session: The highest return in a single session over the analyzed period.
- Worst session: The lowest return in a single session over the analyzed period.
- Suggested Capital: Suggested Capital is a calculated value which uses the system's worse historical drawdown and volatility to target a future drawdown less than -33%. No guarantee can be made that the system will not lose significantly more than 33% of the suggested capital amount.
- Required Capital: Required Capital is the amount which must be in the account in order to activate the system for live trading, and is based on the contract's margin and the worst historical session loss for the system.
The “Export to Excel” button, located at the bottom right corner, exports the strategy results to an Excel sheet.
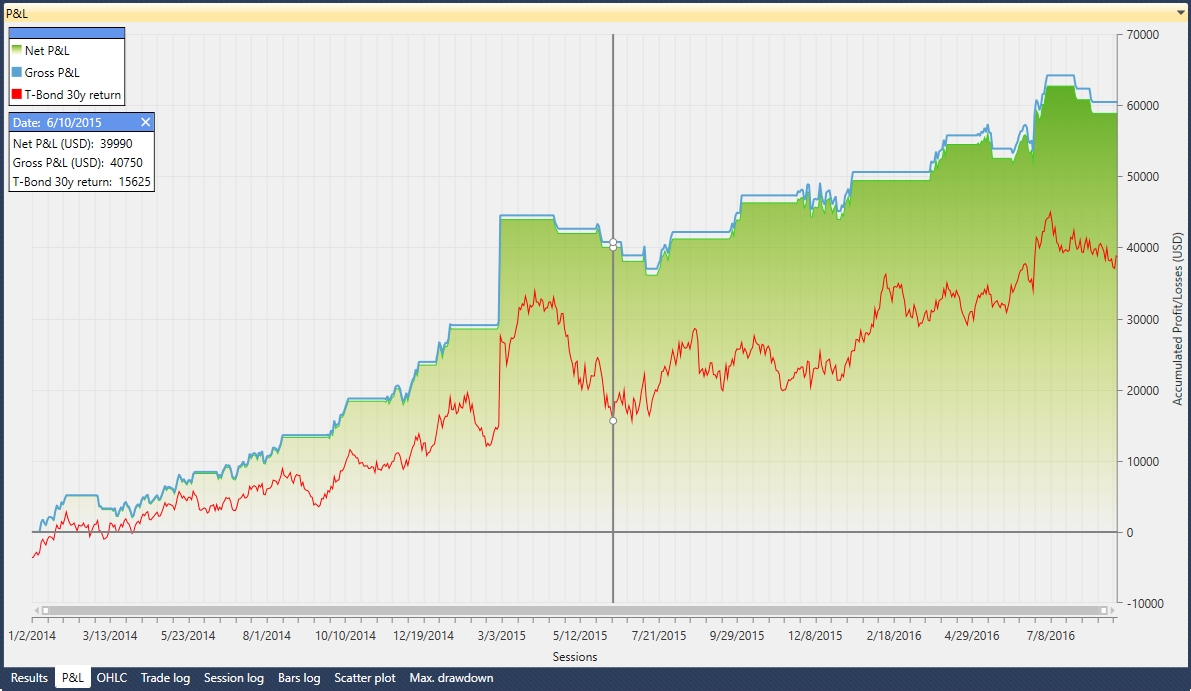
P&L
The P&L chart shows the overall benefit or loss over the analyzed period, commission, slippage and license cost free.
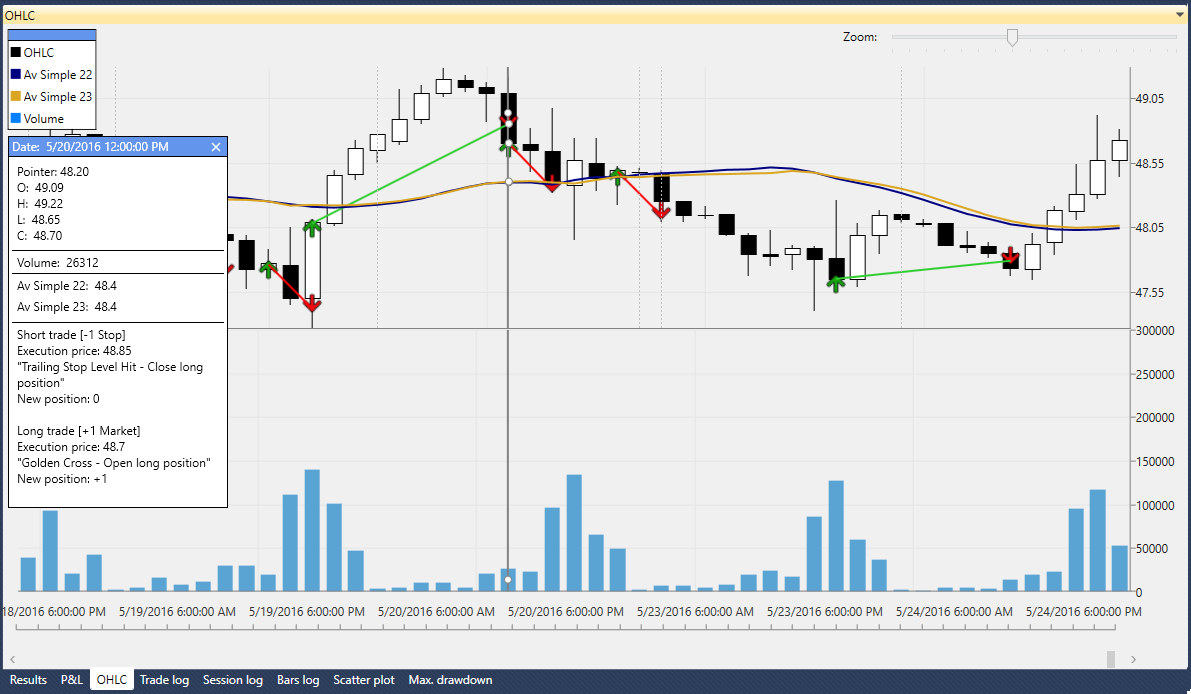
OHLC
On the OHLC chart we can find the following information:
- The market data (in candle format: Open-High-Low-Close).
- The volume.
- The indicators we’ve added to our strategy.
- The trades executed by the strategy, along with their custom text tags (green arrows represent long positions, while red arrows represent short positions).
- The P&L for each order and straight lines joining trades (the lines are green if the P&L is positive, or red if negative).
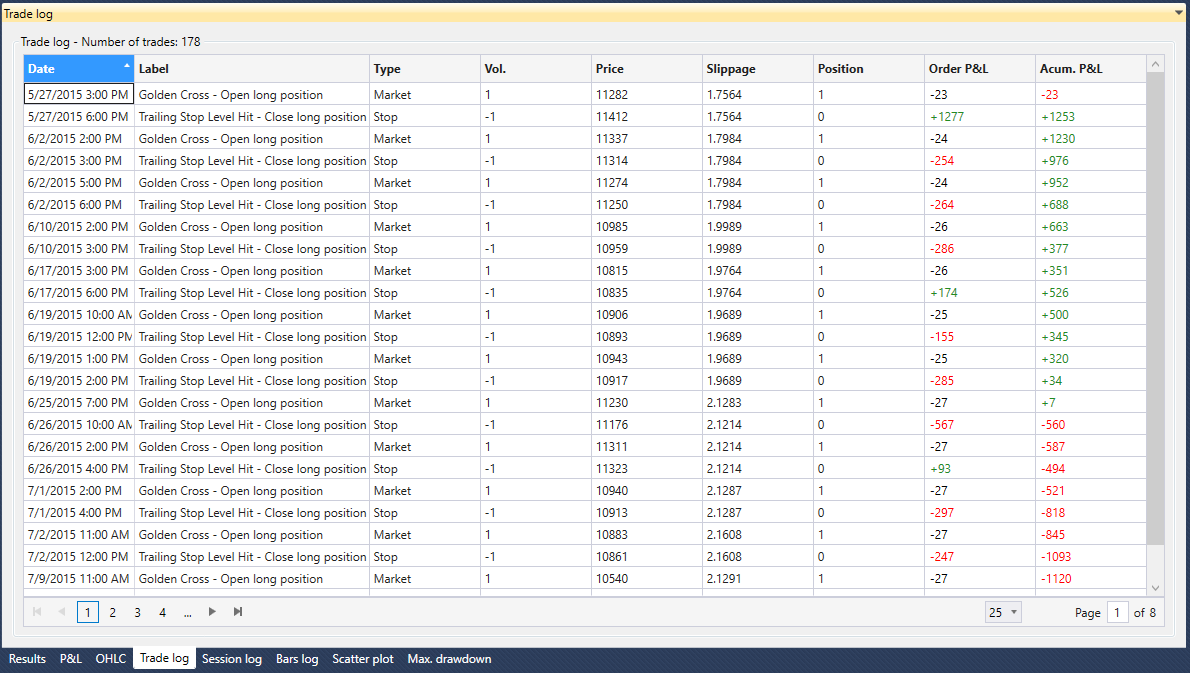
Trade log
List with every trade the strategy has executed.
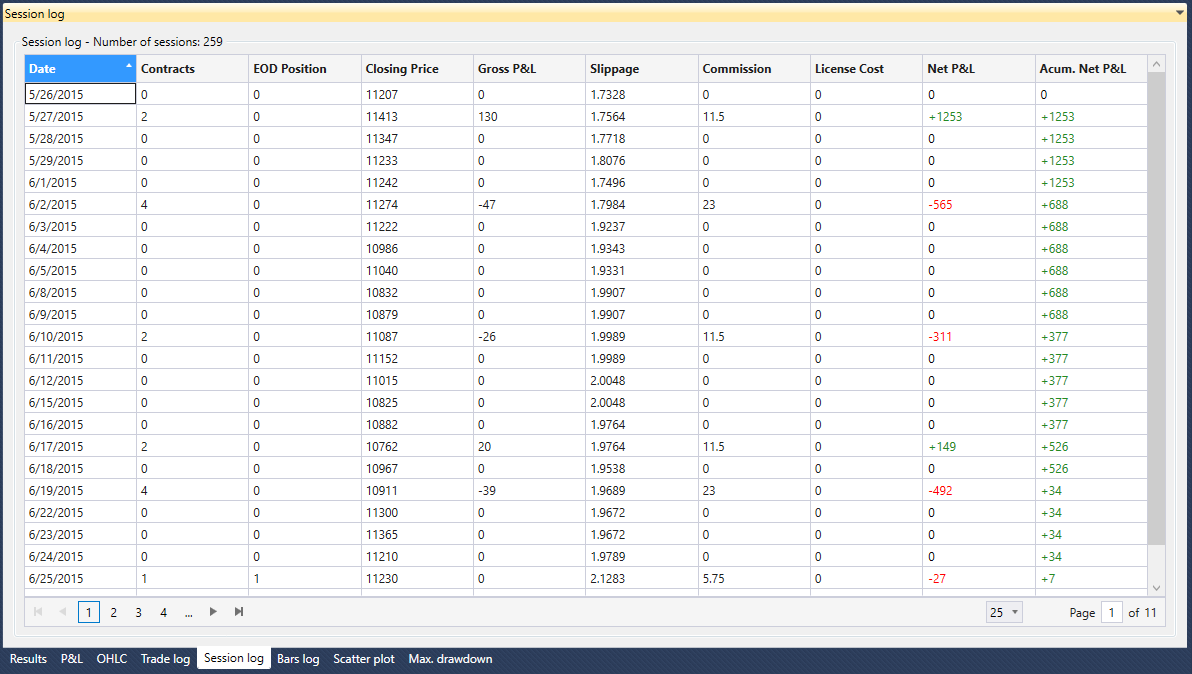
Session log
Detailed day-by-day information of the strategy.
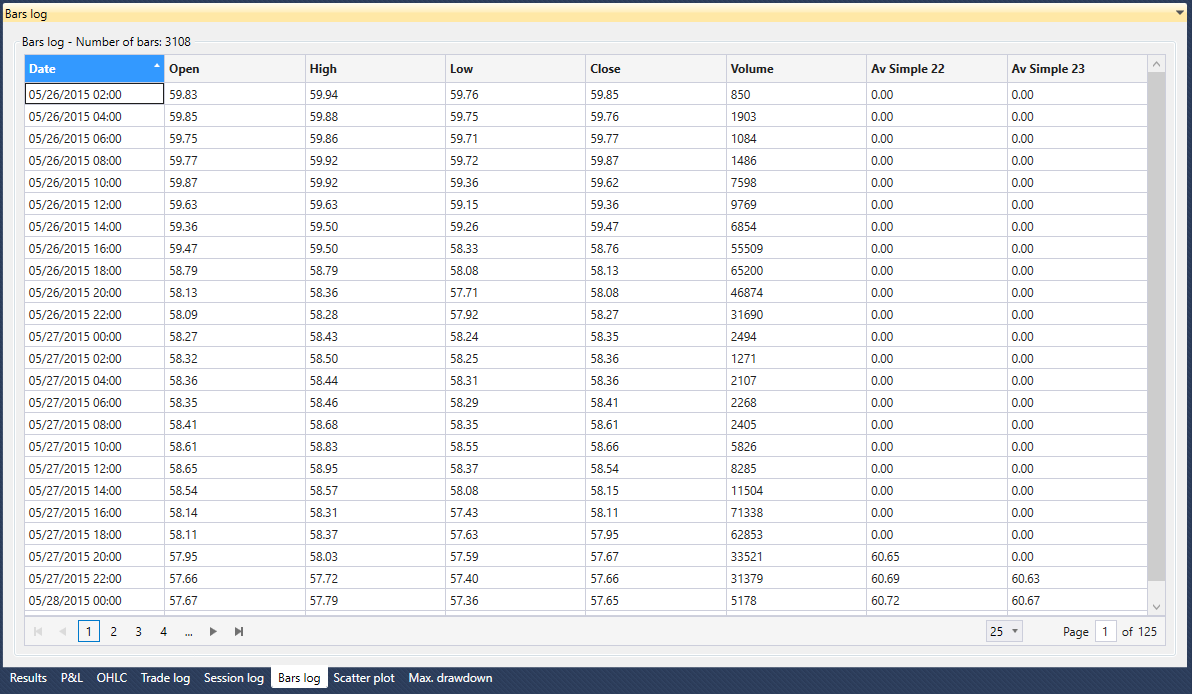
Bars log
List of all bars using the strategy.
Scatter plot
Scatter plot chart with the trades executed by the strategy.
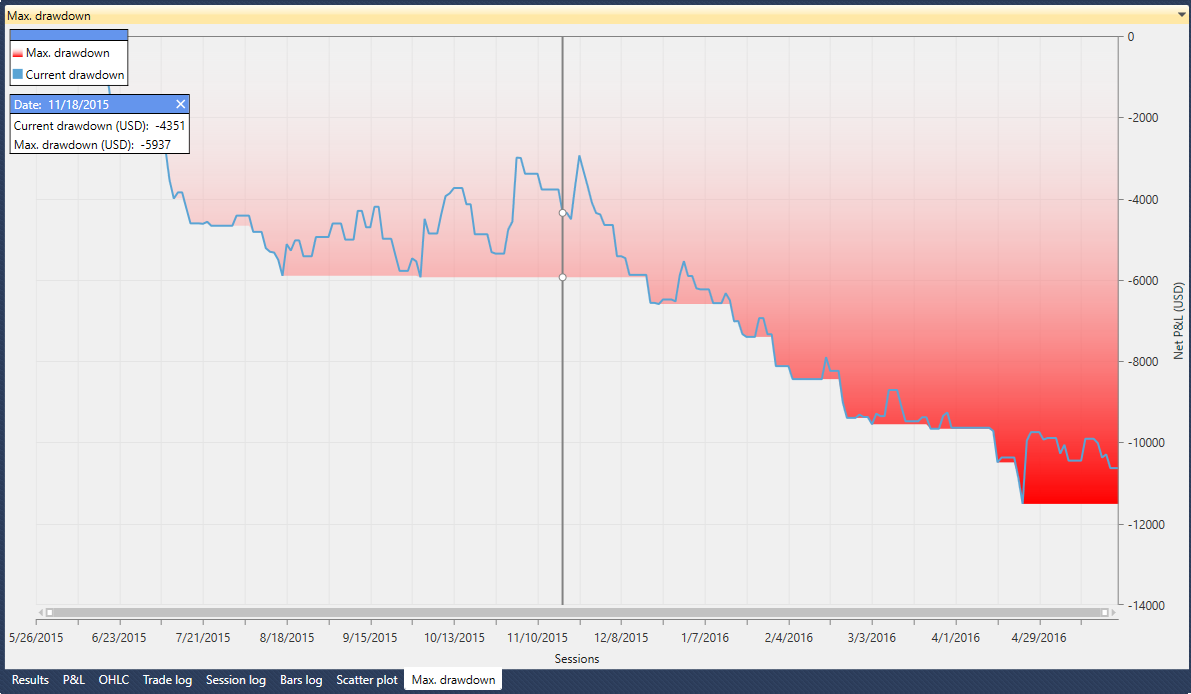
Maximum drawdown
Plot representing the losses of the strategy.
Output
In the output window we can see the log traces we’ve set in our strategy.
For further information about log traces, see the section Debugging strategies with Visual Studio.
OptimizerProject
To create an Optimizer project, start the Toolkit v2. Once open, we see the dialog titled “Create a new project” (if the dialog doesn’t show up, go to the top menu File → New → Project). Click Next.
After clicking Next we’ll see two options to create a project:
- Backtest
- Optimizador
Choose Optimizer and click Next.
Once chosen the Optimizer project we have to load the assembly previously generated using TradingMotion SDKv2 (we can see the default one already loaded). Click load and search for the strategy assembly with which we want to create the project. Once chosen, click Finish.
After this, the Optimizer project will be created and ready to start working with.
Optimizer project tabs
A continuación se describen las diferentes partes de la interfície de un proyecto Optimizador.
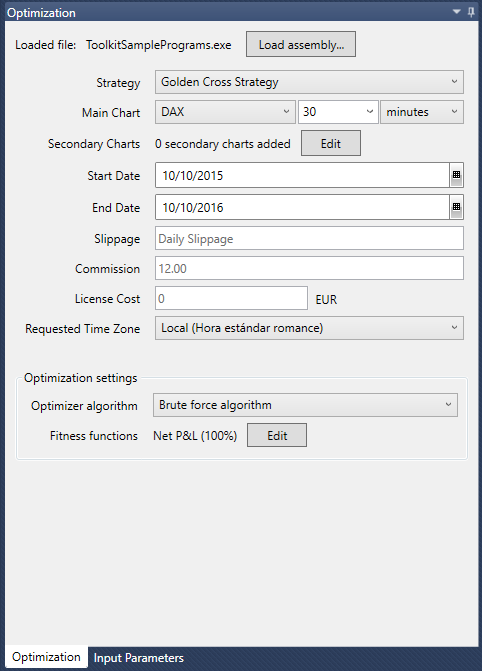
Optimizer
- Loaded File: Assembly containing the strategy coded with TradingMotion SDKv2.
- Strategy: Strategies included in the binary file.
- Main Chart: Product on which the backtest, size of the bars and the unit of time (minutes or days) will be held.
- Secondary Charts: Secondary charts that the strategy may use.
- Start Date: Start date of the backtest.
- End Date: End date of the backtest.
- Slippage: Slippage is the difference between the price at which theoretically a system should have been executed and the price it has actually executed in the market. By default you will see the average slippage for each combination of symbols / day we are simulating.
- Commission: We can specify a fixed amount for each contract of the strategy. By default you will see the real commission marked by the FCM.
- Licence Cost: Monthly license price the developer will charge his customers. The default is 0 (free).
- Time Zone: The start and end dates of the backtest are in the time zone specified by the user. Bars reach the strategy in the same time zone.
To add secondary charts click on the Edit button and the following screen will appear:
We choose the symbol, compression and unit of time (minutes or days), press Add and it will appear on the list of added charts. We can add the charts we want, and once added click Save.
Optimization Settings
We can choose between two different optimization algorithms:
- Brute Force: The simplest algorithm. It calculates the different combinations following a precise order, starting with the value of the first parameter combined with the values of the other parameters, following with the second and so on.
- Genetic: Artificial intelligence based algorithm. It calculates the different combinations following an efficient selection mechanism combining those values that show a better result (based on the fitness functions).
Fitness functions
The fitness functions guide our genetic algorithm through the research of the best solutions. It can be based on more than one parameter. For example, if our fitness function is based on P&L and Sharpe Ratio, our algorithm will give priority to results with good P&L and Sharpe Ratio to be taken as base for better results.
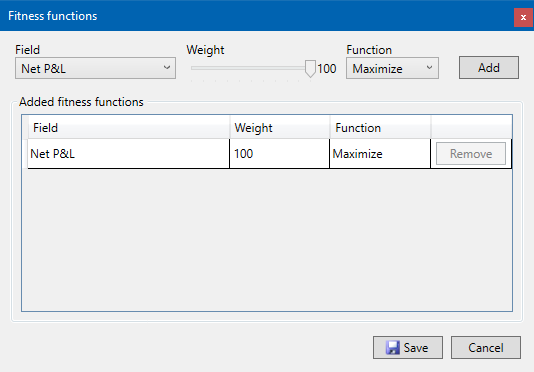
To add parameters to the fitness function click Edit and the following window will show up.
We can choose the parameter, its weight within the function and if we want to maximize or minimize its value (give priority to greater or lower values). If we click Add, it will be added to the Added Fitness Functions list. We can add as many parameters as we want. Once done, click Save.
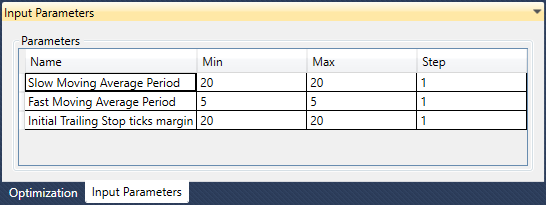
Input Parameters
Here are shown the parameters we’ve exposed when we coded our strategy.
Combinations
The range between the values min and max are the limits that each parameter will have on its combinations during the optimization. The step value is the increment that will be added each time to the min value up until the max value. For example, with a min value of 20, max value of 30 and step value of 2, the values of said parameter will be 20-22-24-26-28-30.
Results
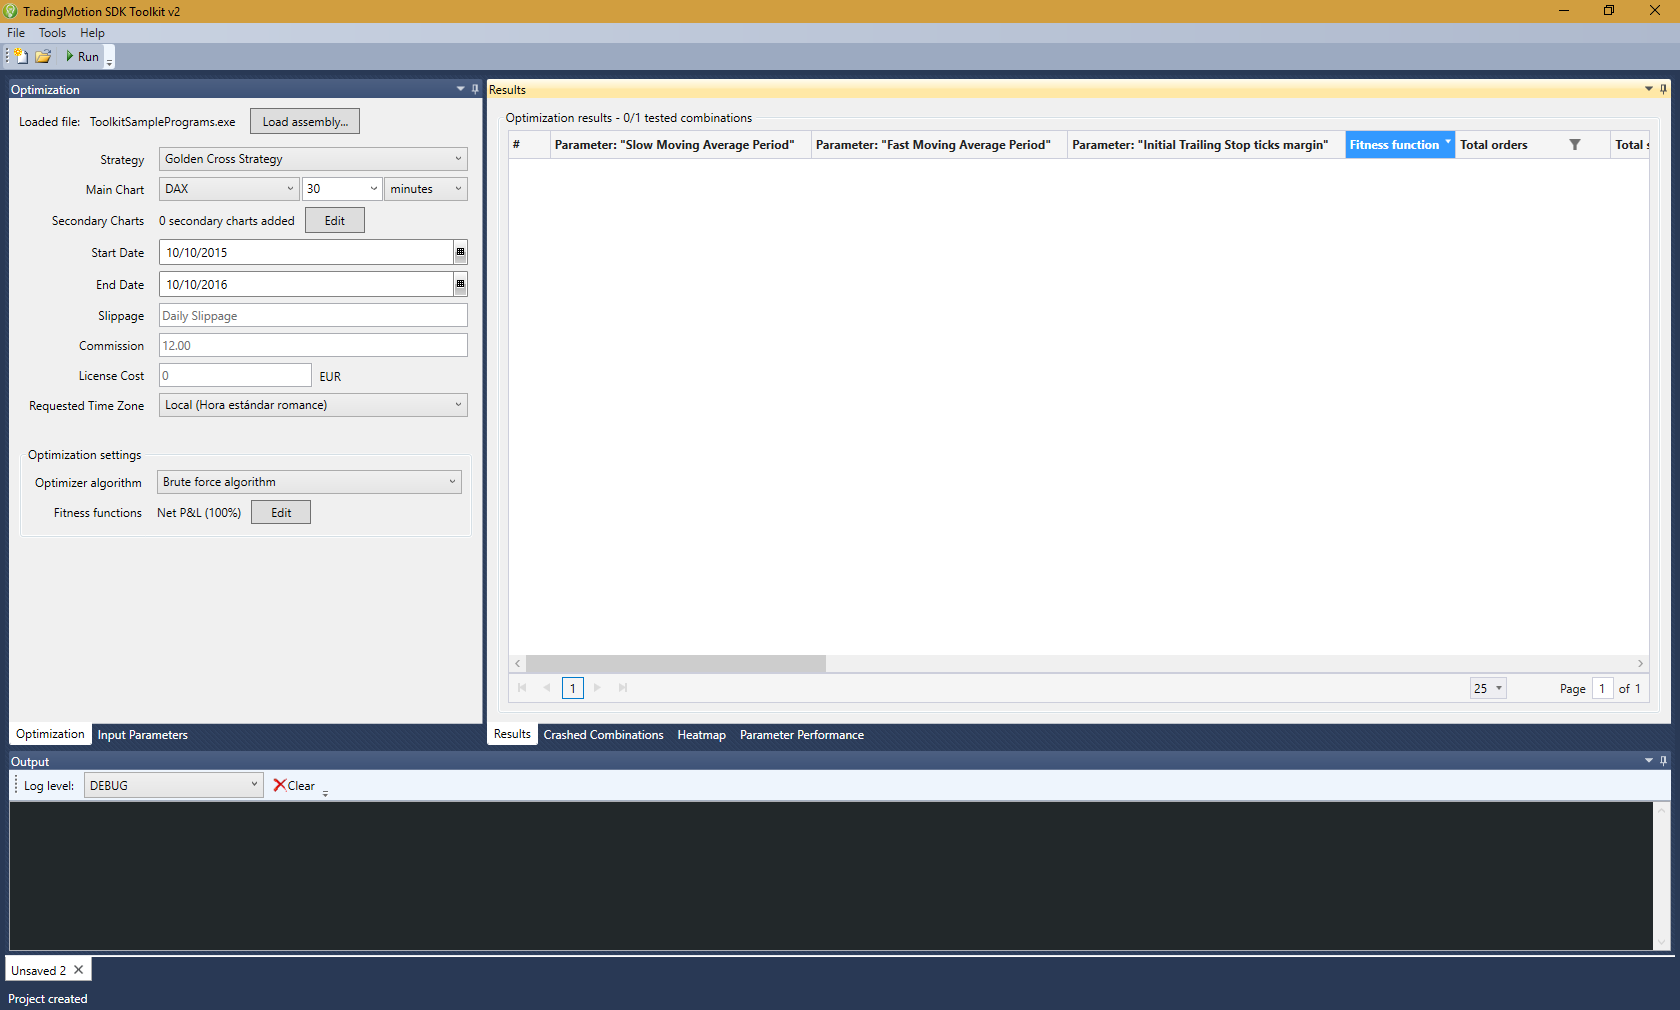
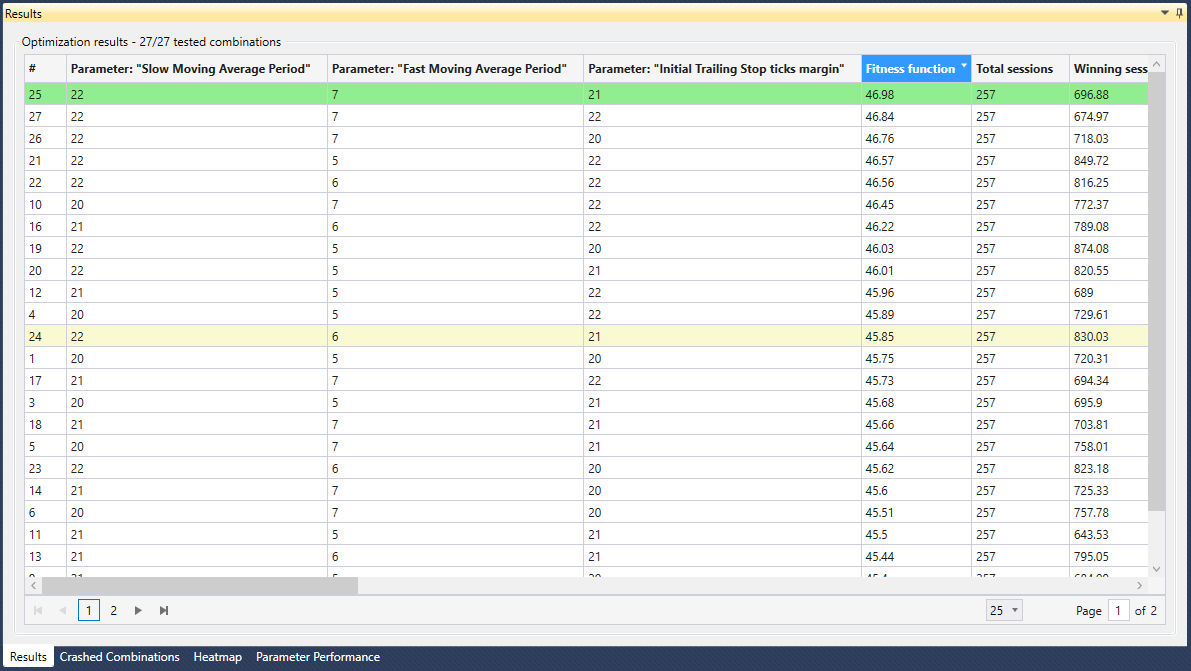
It shows a list with every combination done by the optimizing algorithm. We can find the parameters and several performance metrics in this list.
- The green highlighted row shows the best combination based on the fitness function.
- The yellow highlighted row shows the combination recommended by the system. It’s decided based on a grouping artificial intelligence heuristical based algorithm called “closest neighbor”.
If we click on the symbol
![]() which is in the title of the column a form to filter the results will show.
which is in the title of the column a form to filter the results will show.
Every performance field can be chosen. We pick a field, a function (greater than or lower than) and a value, and click Filter. In our screenshot above, we have filtered by Profit Factor > 1.6.
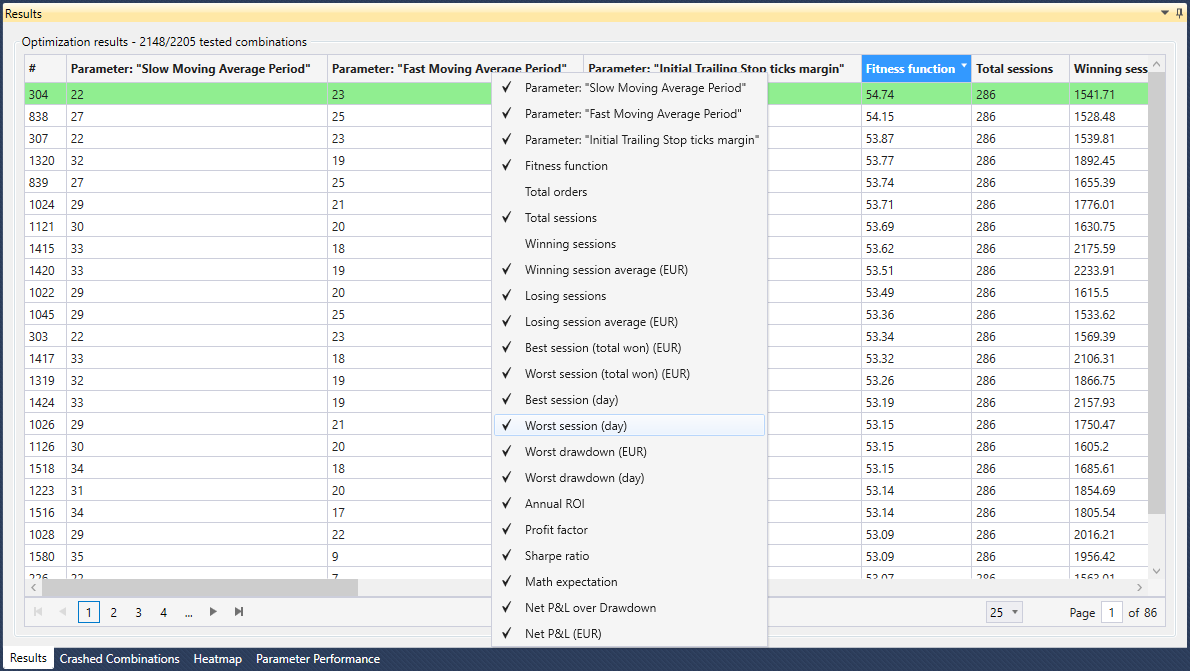
To show/hide a column, we can right click on the header of any column and we’ll see the next context menu:
It contains a list of every column. We can choose which columns are visible and which are not. The check on the left of the text means that that column is visible.
To get more information about a specific optimization result, double click the desired row and the next window will open:
As we can see, this window has the same tabs than a backtest project, but this window has a new button “Create backtest project”. This button exports this specific optimization result to a backtest project.
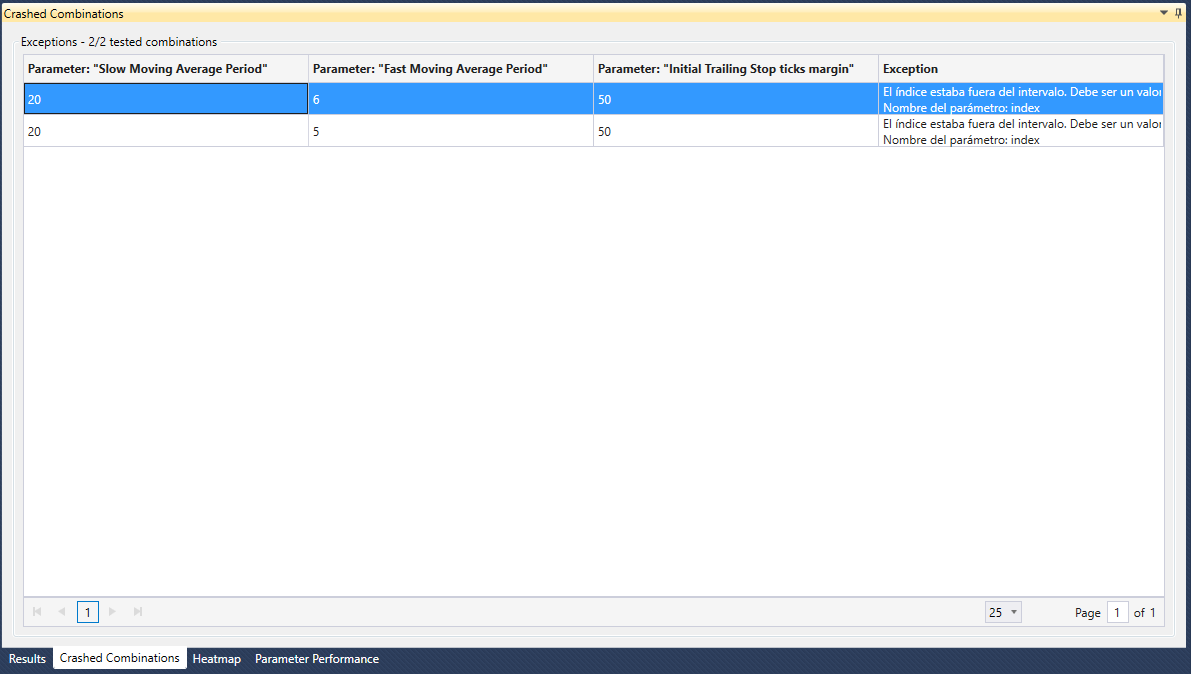
Crashed Combinations
It shows a detailed list of every combination where the backtest has failed.
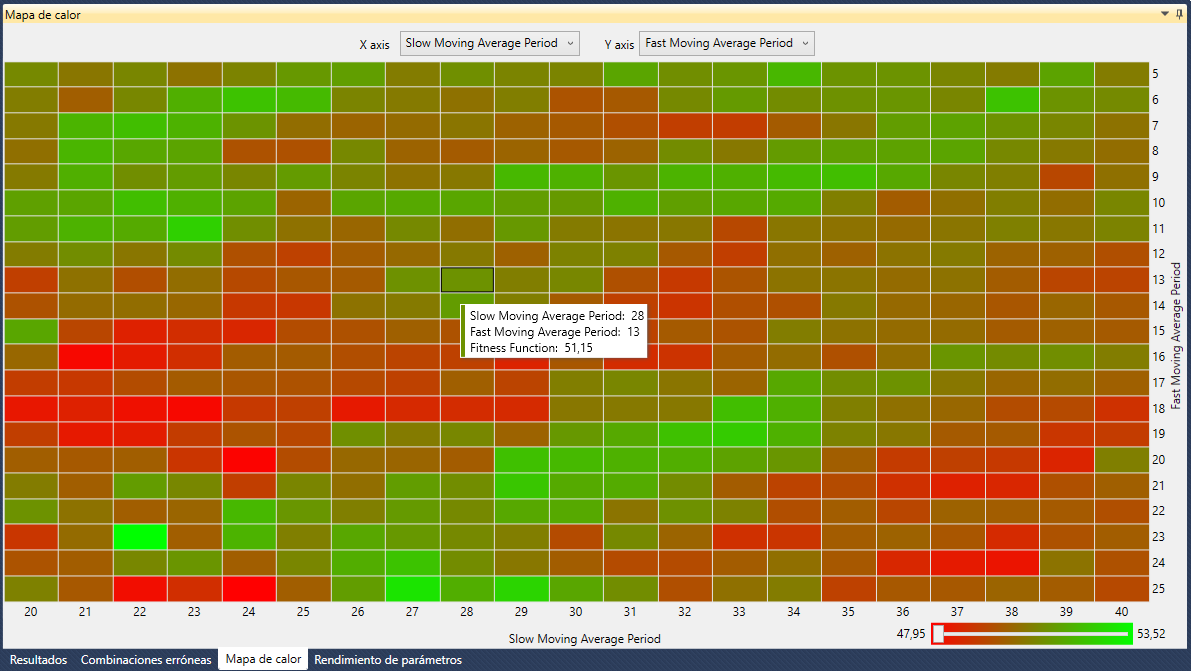
Heatmap
The heatmap chart helps to detect groups of neighbor parameters with better performance.
For example, this heatmap is comparing the next pair of parameters: “Slow Moving Average Period” against “Fast Moving Average Period”. It can be seen at first sight that the pair Slow Moving Average Period 27 - Fast Moving Average Period 25 has the greener color. This means that this combination works better than, for example, the pair Slow Moving Average Period 29 - Fast Moving Average Period 18 (in red).
The heatmap helps us quickly identify the “hot areas” (areas where parameter combinations give their best performance).
The two parameter lists on the top area let us pick the parameter pair to analyze.
The color filter on the bottom right area sets the color threshold. This way we can focus on the areas with similar values.
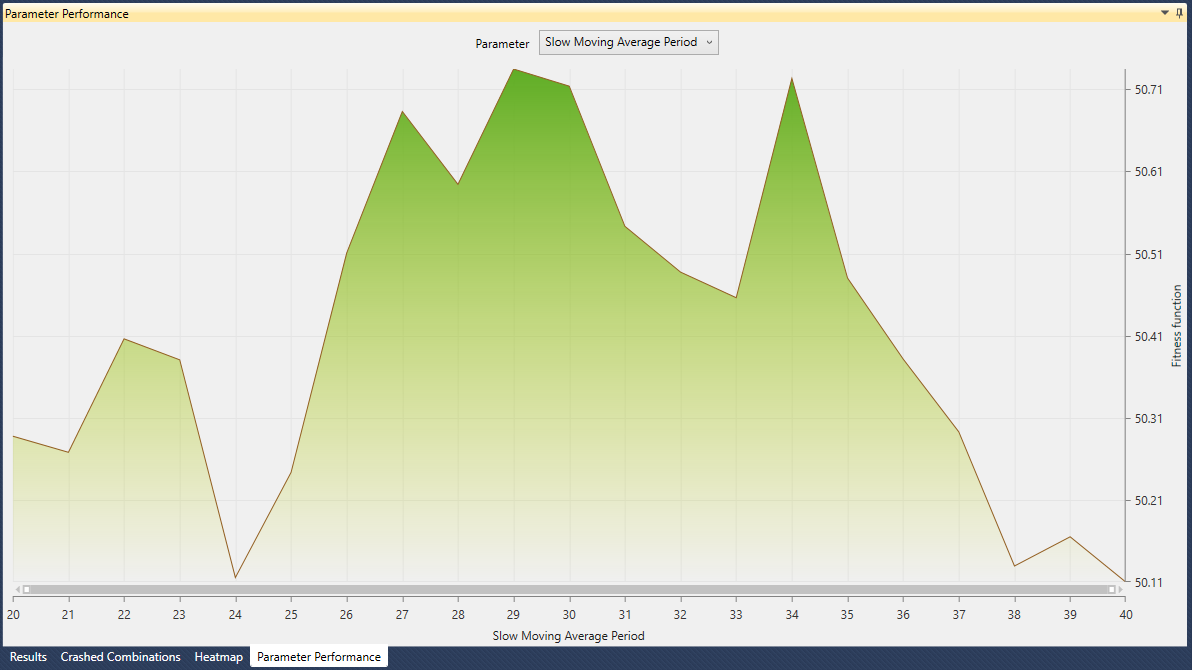
Parameter performance
This chart shows the performance of a single parameter.
The different optimization values of the parameter are represented by the horizontal axis of the chart, while the vertical axis shows the score of each value. At the top of the chart there’s a list to pick any parameter to analyze its performance.
Output
In the output window we can see the log traces we’ve set in our strategy.
For further information about log traces, see the section Debugging strategies with Visual Studio.
Import strategies from v1 to v2
We have created a tool to convert strategies coded in TradingMotion SDKv1 to v2. This way you can use your old strategies in v1 in our Toolkit v2.
Please, before starting with the conversion, check that your v1 project works and compiles correctly.
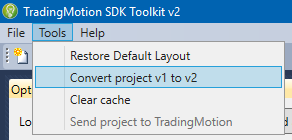
To convert a project to SDK v2, go to the menu Tools → Convert project v1 to v2.
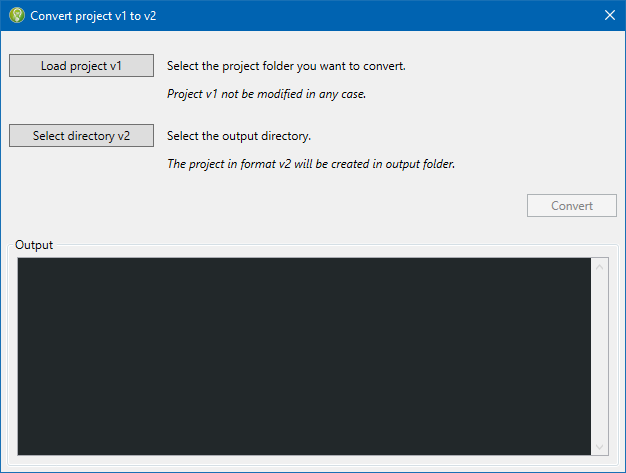
A new window will show up, with three buttons:
- Load project v1: Selects the v1 project file.
- Select directory v2: Selects the directory to store the v2 project.
- Convert: Starts the conversion.
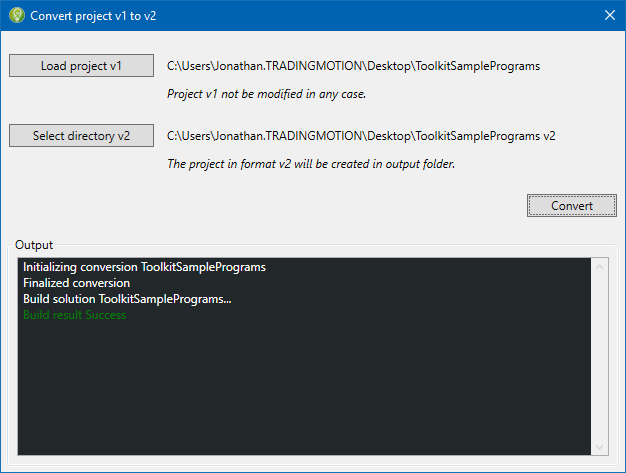
Once the v1 project is loaded and the v2 directory is chosen, we can click Convert.
The conversion process will start. The Output log will inform us about the process and result.
If everything has gone correctly, the output directory will open, where we’ll find the project compiled and ready to use.
Upload strategies to TradingMotion marketplace
Before sending a strategy to the marketplace we are going to explain strategies and its versions. Let's say we have a strategy called Golden Cross Strategy which has 3 exposed parameters:
Strategy name: Golden Cross Strategy
Parameters:
- Slow Moving Average Period
- Fast Moving Average Period
- Initial Trailing Stop ticks margin
Let's also say we can get 3 different versions modifying the parameter values (but not the strategy code), one version using Dax, another using Aex and the last one using Ibex.
Golden Cross Strategy versions:
- Version name: Golden Cross Dax 60'
- DAX 60 Minutes
- Slow Moving Average Period: 20
- Fast Moving Average Period: 5
- Initial Trailing Stop ticks margin: 20
- Version name: Golden Cross Aex 147'
- AEX 147 Minutes
- Slow Moving Average Period: 17
- Fast Moving Average Period: 8
- Initial Trailing Stop ticks margin: 75
- Version name: Golden Cross Ibex 15'
- IBEX35 15 Minutes
- Slow Moving Average Period: 25
- Fast Moving Average Period: 2
- Initial Trailing Stop ticks margin: 47
As we can see, all 3 versions are the same strategy (Golden Cross Strategy). The first time we want to upload a version we have to create the strategy Golden Cross Strategy. Once created, if we want to upload a new version we'll just have to select it. If we ever modify the strategy code, it will be necessary to create a new strategy, as it wouldn't be the same as the previous one.
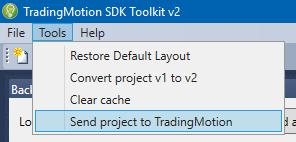
To upload a strategy to the TradingMotion marketplace, go to the upper menu Tools → Send project to TradingMotion (this menu item will only be enabled when the current project is a backtest project and it has been run at least once).
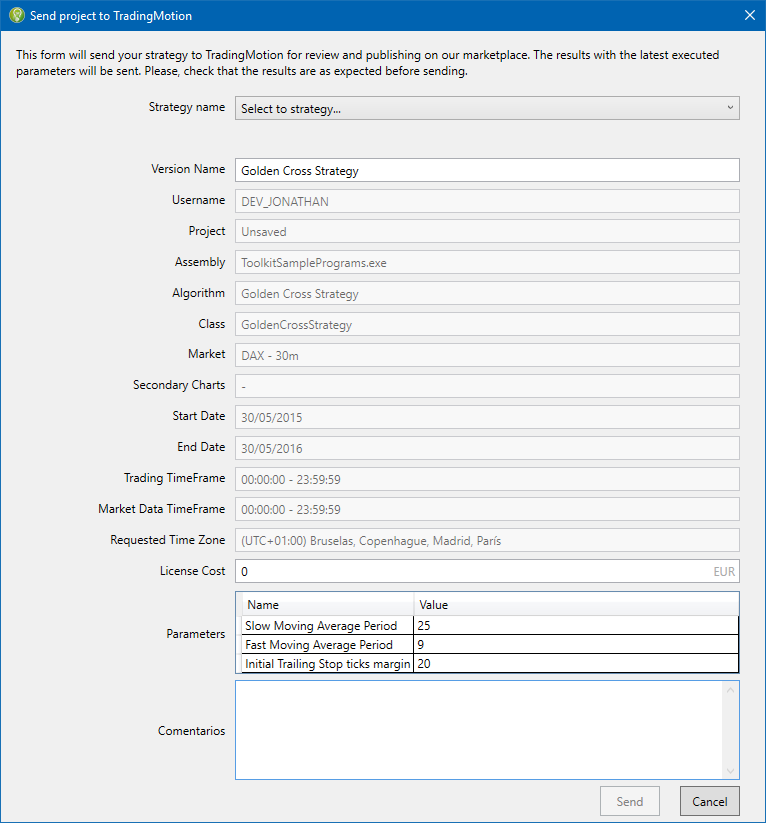
Once clicked on Send project to TradingMotion we'll see a new window with a summary of the strategy parameters (start date, end date, product and bar size...). Most of the fields are not editable. If you want to change any of these fields, you will have to change the strategy settings and run a new backtest.
Editable fields:
- Strategy name: Select the strategy from the list. If this is the first version of the strategy and we haven't created it already, we have to select <Add new strategy…> and fill the New Strategy field with the desired name.
- Version name: This is the name that will be shown upon the TradingMotion marketplace.
- License cost: The monthly license cost that you wish to apply over the strategy. If you modify this value, a new strategy will be run to apply the monthly cost to the result. Any time you can modify the price on the developer portal.
- Comments: Anything you want to tell us about the strategy version you can write it down here.
Once filled these fields, we can send the strategy to the TradingMotion marketplace clicking Send. We will get in touch with you after reviewing your strategy to confirm its release.
Base Library Overview
The base library is compiled into TradingMotionSDKv2.dll assembly, and its reference is required for developing any TradingMotion Program. This base library includes all the concepts and components required to trade on any financial market.
TradingMotionSDKv2 namespaces:
- TradingMotion.SDKv2.Markets: Contains the classes referring to Market concepts.
- TradingMotion.SDKv2.Markets.Symbols: Contains the classes that define the available financial securities to trade.
- TradingMotion.SDKv2.Markets.Indicators: Contains the classes that model the concepts related to Technical Indicators.
- TradingMotion.SDKv2.Markets.Order: Contains the classes used to trade the markets.
- TradingMotion.SDKv2.Markets.Series: Contains the Serie data-structure, that provides an easy method for the kind of "lookback" operations that are commonly used on trading.
- TradingMotion.SDKv2.Algorithm: Contains the classes referring to program execution/simulation.
- TradingMotion.SDKv2.Programs.InputParameter: Contains the classes that define parameters that developers can expose externally.
TradingMotionSDK base library contains some other namespaces. These are used by internal processes (like data retrieval webservices, or statistics calculations…) and developers are not expected to interact with them.
Main Classes
Chart
Models a financial Open-High-Low-Close (OLHC) chart in the application. It is conceptually defined by two parameters: the symbol in which the algorithm will be executed, and the bar timeframe that it uses.
Symbol
Encapsulates all the information regarding a given financial product that it is tradeable through the TradingMotionSDK. The information contains the name, currency, tick size, point value, market hours and so on.
For a complete list of available products, see Appendix II - Available Products.
Bar
Models a candlestick price bar, with the open-high-low-close values, its date and time, its period timeframe, and the volume of traded contracts during it.
Serie
This class models a List of values that are accessed in reverse order. Turns out that it is pretty useful for the kind of "lookback" operations that are commonly done on trading strategy development.
For example, having a Dim closePrices As
Serie(Of Double), we can access the
latest (newest, most recent) close price with the instruction closePrices(0),
the previous close price with closePrices(1), and so on.
With Serie objects it is extremely simple to detect crossings. For example imagine we have the
previous Dim closePrices As
Serie(Of Double) and the value of yesterday's
maximum stored in a plain variable Dim yesterdayHigh As
Double. To detect if we are breaking above yesterday's high price,
we would do this in VB.NET:
Visual Basic.NET
If (closePrices(1) < yesterdayHigh) And
    closePrices(0) > yesterdayHigh) Then
    'Previous bar price was below yesterday's high and
    current bar price is above yesterday's high
    Console.WriteLine("Yesterday's high breakout detected!")
End If
C#
if (closePrices[1] < yesterdayHigh && //Previous bar price was below yesterday's high
    closePrices[0] > yesterdayHigh) //Current bar price is above yesterday's high
{
    Console.WriteLine("Yesterday's high breakout detected!");
}
As a final note, Serie objects has a MaxElements property in order to optimize system memory usage. If MaxElements is set (<> 0), the serie will contain only the MaxElements newest items. That means that a Serie object with MaxElements = 2 will return Nothing if we try to access a third element, even if we have previously added 10 values:
Visual Basic.NET
Dim mySerie As Serie(Of String) = New Serie(Of String)("mySerie")
mySerie.MaxElements = 2

mySerie.AddValue("1st element")
mySerie.AddValue("2nd element")
Console.WriteLine(mySerie(0)) 'This prints "2nd element"
Console.WriteLine(mySerie(1)) 'This prints "1st element"

mySerie.AddValue("3rd element")
Console.WriteLine(mySerie(0)) 'This prints "3rd element"
Console.WriteLine(mySerie(1)) 'This prints "2nd element"
Console.WriteLine(mySerie(2)) 'This prints Nothing because MaxElements = 2, so we are trying to access an out of range element
C#
Serie<String> mySerie = new Serie<String>("mySerie", false);
mySerie.MaxElements = 2;

mySerie.AddValue("1st element");
mySerie.AddValue("2nd element");

Console.WriteLine(mySerie[0]); //This prints "2nd element"
Console.WriteLine(mySerie[1]); //This prints "1st element"

mySerie.AddValue("3rd element");
Console.WriteLine(mySerie[0]); //This prints "3rd element"
Console.WriteLine(mySerie[1]); //This prints "2nd element"
Console.WriteLine(mySerie[2]); //This prints null because MaxElements = 2, so we are trying to access an out of range element
BarSerie
BarSerie is a helper class that is available on both TradingMotionSDK programs (EventStudy and Strategy), and allows developers to access previous bar data through its Serie object properties:
- Serie(Of Bar) Bars
- Serie(Of DateTime) Time
- Serie(Of Double) Open
- Serie(Of Double) High
- Serie(Of Double) Low
- Serie(Of Double) Close
- Serie(Of Double) Volume
Indicator
Indicator is an abstract class that models a technical indicator. Technical indicators are "processes" that take an input serie, perform some calculations, and return several output series that we can use in our TradingMotion programs.
Developers can come up with their own technical indicators. The process would be:
- Create a custom class that inherits from Indicator
- Choose the type of the Input Serie (it can be a Serie(Of Double) or a Serie(Of Bar))
- Declare the output Serie(Of Double) that the custom indicator will provide as a result
- Implement the calculation process, overriding the Indicator.Compute method
Visual Basic.NET
Imports TradingMotion.SDKv2.Markets
Imports TradingMotion.SDKv2.Markets.Indicators
Imports TradingMotion.SDKv2.Markets.Series

Public Class ExampleTradingMotionIndicator
    Inherits TALibIndicatorSuperclass(Of Bar)

    Public Sub New (ByVal source As Serie (Of Bar))
        MyBase.new(source)
    End Sub

    Public Overrides Function GetWarmUpPeriod() As UInteger
        Throw New NotImplementedException
    End Function

    Public Overrides Sub Compute()
        Throw New NotImplementedException
    End Sub
End Class
C#
using TradingMotion.SDKv2.Markets;
using TradingMotion.SDKv2.Markets.Indicators;
using TradingMotion.SDKv2.Markets.Series;

namespace ExampleStrategy
{
    public class ExampleTradingMotionIndicator : TALibIndicatorSuperclass<Bar>
    {
        public ExampleTradingMotionIndicator(Serie<Bar> source) : base(source)
        {
        }

        public override uint GetWarmUpPeriod()
        {
            throw new NotImplementedException();
        }

        public override void Compute()
        {
            throw new NotImplementedException();
        }
    }
}
Visual Basic.NET
Imports TradingMotion.SDKv2.Markets
Imports TradingMotion.SDKv2.Markets.Indicators
Imports TradingMotion.SDKv2.Markets.Series

Public Class ExampleTradingMotionIndicator
    Inherits TALibIndicatorSuperclass(Of Bar)

    Dim TimePeriod As Integer

    Public Sub New (ByVal source As Serie (Of Bar), ByVal period As Integer)
        MyBase.new(source)

        Name = "ExampleTmIndicator"
        TimePeriod = period
        AddOutputSerie(New Serie(Of Double)(Name))
    End Sub

    Public Function GetTmIndicator() As Serie(Of Double)
        Return ME(Name)
    End Function

    Public Overrides Function GetWarmUpPeriod() As UInteger
        Return TimePeriod
    End Function

    Public Overrides Sub Compute()
        Throw New NotImplementedException
    End Sub
End Class
C#
using TradingMotion.SDKv2.Markets;
using TradingMotion.SDKv2.Markets.Indicators;
using TradingMotion.SDKv2.Markets.Series;

namespace ExampleStrategy
{
    public class ExampleTradingMotionIndicator : TALibIndicatorSuperclass<Bar>
    {
        private int _timePeriod;

        public ExampleTradingMotionIndicator(Serie<Bar> source) : base(source)
        {
            Name = "ExampleTmIndicator";
            _timePeriod = period
            AddOutputSerie(new Serie<double>(Name))
        }

        public Serie<double> GetTmIndicator()
        {
            return this[Name];
        }

        public override uint GetWarmUpPeriod()
        {
            return (uint)_timePeriod;
        }

        public override void Compute()
        {
            throw new NotImplementedException();
        }
    }
}
Visual Basic.NET
Imports TradingMotion.SDKv2.Markets
Imports TradingMotion.SDKv2.Markets.Indicators
Imports TradingMotion.SDKv2.Markets.Series

Public Class ExampleTradingMotionIndicator
    Inherits TALibIndicatorSuperclass(Of Bar)

    Dim TimePeriod As Integer

    Public Sub New (ByVal source As Serie (Of Bar), ByVal period As Integer)
        MyBase.new(source)

        Name = "ExampleTmIndicator"
        TimePeriod = period
        AddOutputSerie(New Serie(Of Double)(Name))
    End Sub

    Public Function GetTmIndicator() As Serie(Of Double)
        Return ME(Name)
    End Function

    Public Overrides Function GetWarmUpPeriod() As UInteger
        Return TimePeriod
    End Function

    Public Overrides Sub Compute()
        Dim tm As Double = 0

        If (sourceSerie.Count > Me.GetWarmUpPeriod()) Then
            tm = (100 * sourceSerie(0).Close) / sourceSerie(0).Open
        End If

        Me(Name).AddValue(tm)
    End Sub
End Class
C#
using TradingMotion.SDKv2.Markets;
using TradingMotion.SDKv2.Markets.Indicators;
using TradingMotion.SDKv2.Markets.Series;

namespace ExampleStrategy
{
    public class ExampleTradingMotionIndicator : TALibIndicatorSuperclass<Bar>
    {
        private int _timePeriod;

        public ExampleTradingMotionIndicator(Serie<Bar> source) : base(source)
        {
            Name = "ExampleTmIndicator";
            _timePeriod = period
            AddOutputSerie(new Serie<double>(Name))
        }

        public Serie<double> GetTmIndicator()
        {
            return this[Name];
        }

        public override uint GetWarmUpPeriod()
        {
            return (uint)_timePeriod;
        }

        public override void Compute()
        {
            double tm = 0;

            if (sourceSerie.Count > GetWarmUpPeriod())
            {
                tm = (100 * sourceSerie[0].Close) / sourceSerie[0].Open;
            }

            this[Name].AddValue(tm);
        }
    }
}
TradingMotionSDK includes 120+ Technical Indicators ready to use, such as Moving Averages, Bollinger Bands, ATR, RSI, Harami pattern recognitions, and many more. See Appendix I - Technical Indicators for a complete list.
The most important properties of Indicator objects are:
- Serie sourceSerie: Contains the input data for the technical indicator. This can be a Bar serie (when the indicator computation requires open, high, low and close values) or a double serie (for example when it only requires the close prices). We also can calculate indicators over indicators setting as a sourceSerie the output of another indicator (for example we can compute a moving average of a RSI indicator).
- Serie outputSeries: Contains the output series for the technical indicator. A moving average will contain only one output serie, but, for example, a typical MACD indicator will output 3 different series (MACD, MACD Signal and MACD Average)
- Boolean ShownInChart: Returns whether the indicator will be shown in the OHLC chart or not (default true).
- Boolean ShownOverInputSeries: Returns true if the indicator needs to be drawn over the source serie. If false, it will be drawn in a new subchart below the OHLC main plot (default false).
InputParameter
InputParameter class represent variables that developers can expose externally. This way parameters' value can be changed easily in TradingMotionSDKToolkit, and different values can be tested without having to recompile the TradingMotion program.
Examples of good input parameters could be the period of a moving average, or the price difference to set a Stop Order. See Coding our first Strategy for a real example of InputParameter usage.
Another characteristic of these input parameters is that they can be optimized in TradingMotionSDKToolkit. This means that the system will try many combinations to come up with the one that offers the best value for the performance metric we are optimizing for. See Optimizer Project
Note that allowed types for InputParameter are Integer, Double, String and TimeSpan. Strings can't be optimized.
Visual Basic.NET
Public Overrides Function SetInputParameters() As InputParameterList
    Return New InputParameterList() From()
    {
        New InputParameter("Example Integer", 20),
        New InputParameter("Example Double", 5.5),
        New InputParameter("Example String", "Hello world"),
        New InputParameter("Example TimeSpan", new TimeSpan(15, 0, 0)),
    }
End Function
C#
public override InputParameterList SetInputParameters()
{
    return new InputParameterList
    {
        new InputParameter("Example Integer", 20),
        new InputParameter("Example Double", 5.5),
        new InputParameter("Example String", "Hello world"),
        new InputParameter("Example TimeSpan", new TimeSpan(15, 0, 0)),
    };
}
Order
The Order classes are objects that model orders that are sent to the exchange. Their common properties are:
- Side: Buy or Sell
- Quantity: Unsigned integer. Specifies the number of contracts we want to buy or sell
- Label: Free text field where the developer can "tag" specific orders, in order to help him identify them later (for example on a historical trade list or on an OHLC backtest chart).
- Price: Price level to trigger the order (required for limit/stop orders only)
There are 3 different type of orders:
- MarketOrder: Buys or Sells immediately at the best available current price
- LimitOrder: Sets the maximum or minimum price at which you are willing to buy or sell the security (limit price, required). It guarantees that the trade will be made at a particular price.
- StopOrder: Executed only when the security reaches a particular price (stop price, required). Once the stop price has been triggered, it turns into a market order, so it will be filled at best possible price (the stop price is not guaranteed).
Order objects are only allowed on strategies that use "Advanced Order Management" mode.
In "Advanced Order Management" mode, the orders are sent to the market from the
Strategy.OnNewBar() method, using Strategy.InsertOrder(order As Order)
instruction (See Advanced uses of Strategy Class).
Strategy
Strategy is an abstract class that developers need to subclass in order to create a runnable Strategy TradingMotion Program.
The main method of a strategy is Sub Strategy.OnNewBar(), which is called on every new bar
(both on backtests and real-time trading). In this method, the developer checks the current
market state of the strategy, and using the data available on Technical Indicators and the Bars
object, places the orders to enter/exit accordingly.
Strategy TradingMotionSDKv2 programs can be uploaded to TradingMotion Platform, where after a quality check, can be published on TradingMotion marketplace.
Coding our first Strategy
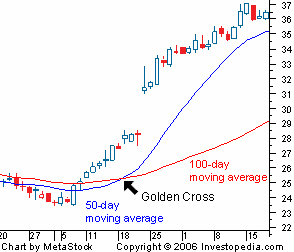
We will encode an automatic strategy based on "Golden Cross": A crossover involving a security's short-term moving average (such as 5-bars moving average) breaking above its long-term moving average (such as 20-bars moving average) or resistance level.
Closing the position using a Trailing Stop.
Trailing Stops are widely used techniques to cut losses and let profits run. It consists in placing a "Stop Order" some points below the buy price, and move it up along with the price, only when it moves at our favor. This way, as long as the price goes up, we keep locking profits. On the other hand, when the price reverses and hits the stop level, the order automatically closes the position.
1. Create a new "Strategy" project
Open Microsoft Visual Studio and creare a new VisualBasic / C# → TradingMotionSDK → TradingMotion Trading Strategy (make sure that .NET Framework 4 is selected).
2. Create our "Strategy" class
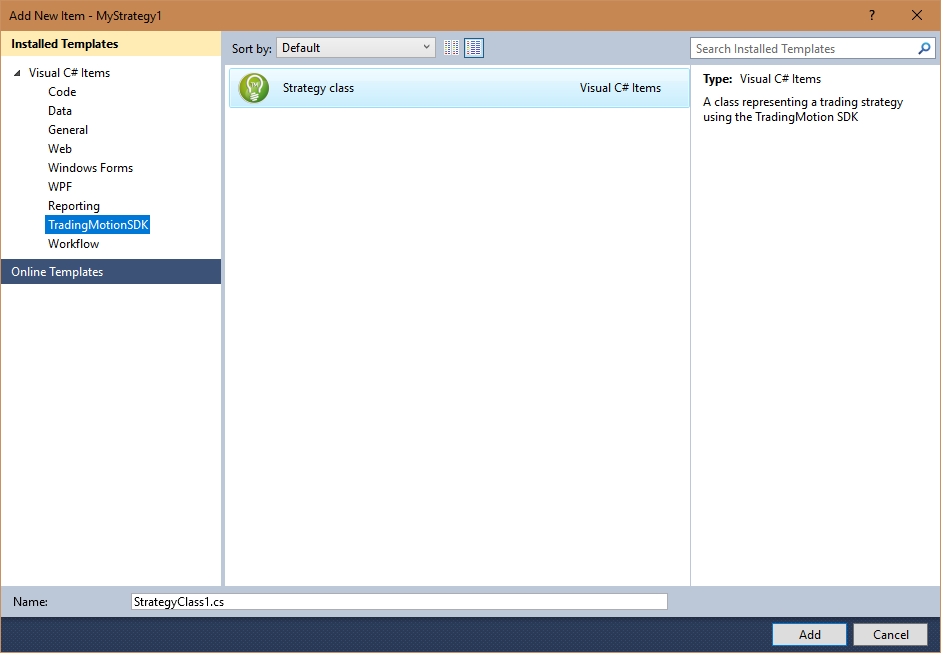
Once the project is created, let's create a new class called GoldenCrossStrategy. Right click on the project → Add → New item → TradingMotionSDK → Strategy class.
The new class contains a skeleton of all the properties and methods required by the strategy.
3. Implement the "Strategy" methods
Public Overrides ReadOnly Property Name As String
Return a textual name for the strategy.
Visual Basic.NET
Public Overrides ReadOnly Property Name As String
    Get
        Return "Golden Cross strategy"
    End Get
End Property
C#
public override string Name
{
    get { return "Golden Cross strategy"; }
}
Public Overrides Function SetInputParameters() As InputParameterList
This method allows the developer to "expose" parameters used by the strategy externally (see Main classes → InputParameter).
We'll expose the periods of the two indicators: the slow moving average and the fast moving average, this way we'll be able to test different value combinations easily. We'll also expose the margin points distance we will use to place our Trailing Stop Order.
Visual Basic.NET
Public Overrides Function SetInputParameters() As InputParameterList
    Dim parameters As New InputParameterList()

    parameters.Add(New InputParameter("Slow Moving Average Period", 20))
    parameters.Add(New InputParameter("Fast Moving Average Period", 5))

    parameters.Add(New InputParameter("Initial Trailing Stop points margin", 15.0))

    Return parameters
End Function
C#
public override InputParameterList SetInputParameters()
{
    InputParameterList parameters = new InputParameterList();

    parameters.Add(new InputParameter("Slow Moving Average Period", 20));
    parameters.Add(new InputParameter("Fast Moving Average Period", 5)),

    parameters.Add(new InputParameter("Initial Trailing Stop points margin", 15D));

    return parameters;
}
Public Overrides Sub OnInitialize()
This method is the right place to create the indicator objects (See Main Classes → Indicator) required by the TradingMotion Program.
It is recommended to declare the Indicator objects as class attributes, and instantiate them in this method. This way will be easier to retrieve their values easily.
Visual Basic.NET
'Declare the moving averages as class attributes
Dim indSlowSMA As SMAIndicator
Dim indFastSMA As SMAIndicator
C#
//Declare the moving averages as class attributes
SMAIndicator indSlowSMA;
SMAIndicator indFastSMA;
Once we defined the indicators as class attributes, we can instantiate them on the OnInitialize
callback method and add them to the strategy with the function Sub AddIndicator(name As String, indicator As Indicator).
Visual Basic.NET
Public Overrides Sub OnInitialize()
    indSlowSMA = New SMAIndicator(Bars.Close, GetInputParameter("Slow Moving Average Period"))
    indFastSMA = New SMAIndicator(Bars.Close, GetInputParameter("Fast Moving Average Period"))

    AddIndicator("Slow SMA", indSlowSMA)
    AddIndicator("Fast SMA", indFastSMA)
End Sub
C#
public override void OnInitialize()
{
    indSlowSMA = new SMAIndicator(Bars.Close, (int)GetInputParameter("Slow Moving Average Period"));
    indFastSMA = new SMAIndicator(Bars.Close, (int)GetInputParameter("Fast Moving Average Period"));

    AddIndicator("Slow SMA", indSlowSMA);
    AddIndicator("Fast SMA", indFastSMA);
}
Public Overrides Sub OnNewBar()
This method is where the developer needs to write the rules to enter/exit the market placing the right orders.
For our particular "Golden Cross" strategy, we have to place a Buy Market Order with size=1 (go long buying 1 contract) when, at the current bar, the fast moving average crosses above the slow one, and set the "stop level" for our trailing stop.
If we are already long, we have to check if the price has fallen below our trailing stop, and close the position accordingly.
Visual Basic.NET
'Declare the Trailing Stop Order as class attribute
Dim trailingStopOrder As StopOrder

Public Overrides Sub OnNewBar()
    If (GetOpenPosition() = 0) Then
        'We're flat. Check if current bar contains a golden cross
        If (indFastSMA.GetAvSimple()(0) > indSlowSMA.GetAvSimple()(0) And
            indFastSMA.GetAvSimple()(1) < indSlowSMA.GetAvSimple()(1)) Then
            'Check if Fast moving average is higher than Slow moving average in current bar and
            'Check if Fast moving average was lower than Slow moving average in previous bar

            'Going Long (Buying 1 Contract at Market price)
            InsertOrder(New MarketOrder(OrderSide.Buy, 1, "Golden Cross - Open long position"))

            'Set the level for our trailing stop
            trailingStopOrder = New StopOrder(OrderSide.Sell, 1, Bars.Close(0) - GetInputParameter("Initial Trailing Stop points margin"), "Trailing Stop Level Hit - Close long position")
            InsertOrder(trailingStopOrder)
        End If
    Else
        'We're long. Check if the price has gone up
        If (Bars.Close(0) > Bars.Close(1)) Then
            'The price has moved in favour of our position, increase the trailing stop level accordingly
            trailingStopOrder.Price = trailingStopOrder.Price + (Bars.Close(0) - Bars.Close(1))
            ModifyOrder(trailingStopOrder)
        End If
    End If
End Sub
C#
//Declare the Trailing Stop Order as class attribute
StopOrder trailingStopOrder;

public override void OnNewBar()
{
    if (GetOpenPosition() == 0)
    {
        //We're flat. Check if current bar contains a golden cross
        if (indFastSMA.GetAvSimple()[0] > indSlowSMA.GetAvSimple()[0] &&
            indFastSMA.GetAvSimple()[1] < indSlowSMA.GetAvSimple()[1])
            //Check if Fast moving average is higher than Slow moving average in current bar and
            //Check if Fast moving average was lower than Slow moving average in previous bar
        {
            //Going Long (Buying 1 Contract at Market price)
            InsertOrder(new MarketOrder(OrderSide.Buy, 1, "Golden Cross - Open long position"));

            //Set the level for our trailing stop
            trailingStopOrder = new StopOrder(OrderSide.Sell, 1, Bars.Close[0] - (double)GetInputParameter("Initial Trailing Stop points margin"), "Trailing Stop Level Hit - Close long position");
            InsertOrder(trailingStopOrder);
        }
    }
    else
    {
        //We're long. Check if the price has gone up
        if (Bars.Close[0] > Bars.Close[1])
        {
            //The price has moved in favour of our position, increase the trailing stop level accordingly
            trailingStopOrder.Price = trailingStopOrder.Price + (Bars.Close[0] - Bars.Close[1]);
            ModifyOrder(trailingStopOrder);
        }
    }
}
4. Debugging our Strategy
Once we have created our GoldenCrossStrategy class, it's time to debug and test whether it is working as expected.
First of all, make sure to set your TradingMotionAPI credentials in the "app.config" file of the project:
<appSettings>
    <add key="TradingMotionAPILogin" value="your_login_here"/>
    <add key="TradingMotionAPIPassword" value="your_password_here"/>
</appSettings>
These credentials are needed to download the required historical market data from TradingMotion servers.
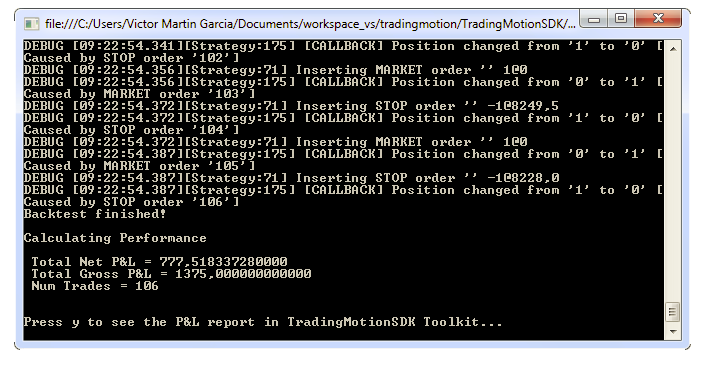
TradingMotion program projects contains a DebugBacktest class, which is a regular console application. We need to instantiate our new Strategy class, so we will change the object type (line 40 in C#, line 38 in VB) from GoldenCrossStrategy to the name of our Strategy. Then, just Run the project (press F5 key) and it will perform a 6 month backtest of our Strategy over 60 min DAX bars, showing a console window with this output:
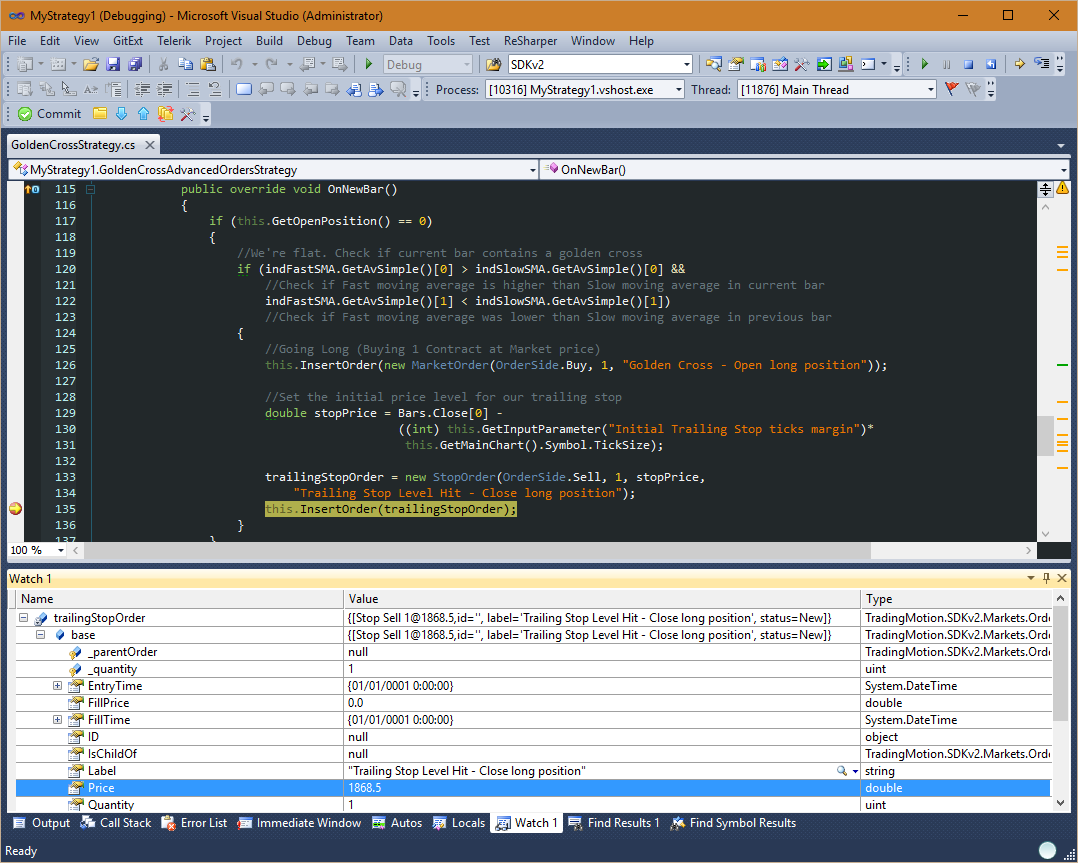
We call this console process the "development backtests", because it allows the programmers to debug the TradingMotion program. We can, for example, place a breakpoint code on any method, and during the backtest the program will pause its execution right there, allowing us to see the state of our variables and execute the code step by step:
Another useful debugging technique is a logging system. TradingMotionSDK uses the popular Apache log4net framework, which allows the programmer to output log statements to a variety of output targets (by default the console and a text file).
TradingMotion programs have the log4net.ILog log protected attribute, which can be used to output log statements. For example, adding this instruction when we're moving the trailing stop order in our favor:
Visual Basic.NET
ModifyOrder(trailingStopOrder)
log.Info("Market moving in our favor :) Rising stop price " + (bar.Close - Bars.Close(1)) + "points")
C#
ModifyOrder(trailingStopOrder);
log.Info("Market moving in our favor :) Rising stop price " + (bar.Close - Bars.Close[1]) + "points");
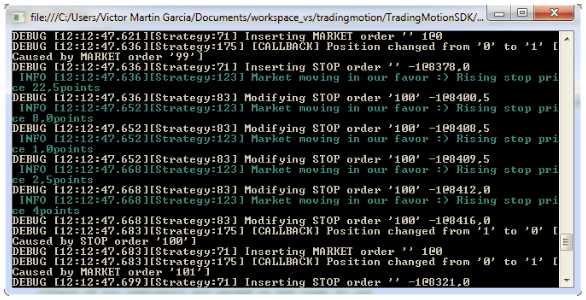
Will produce this output while running a backtest:
Green lines are the output of our custom log.Info statements. This way we can add as many output statements as we want, allowing us to monitor the behaviour of our TradingMotion programs at a glance.
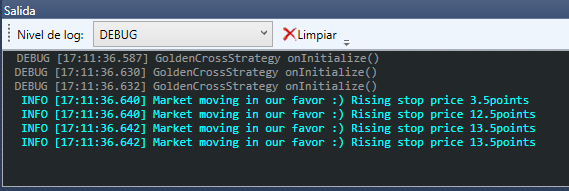
We can also see the traces of the log in the Toolkitv2 in the Output tab:
Advanced uses of Strategy Class
Simple and advanced order management
When coding a strategy, the developer can choose between using simple order management or advanced order management. The right selection for this setting is important, as it will condition the way the developer writes the code. Choosing between one or the other is done by setting the strategy attribute UsesAdvancedOrderManagement true or false, which will lead to use advanced orders or not, respectively.
In Simple Order Management, when the strategy is flat, he/she can send orders to the
market using the strategy methods Buy() and Sell(). The two first parameters of each function
(order type and quantity) are mandatory, while the other two (price and label) are not. The order
type must be "Market", "Limit" or "Stop". In case of choosing "Limit" or "Stop", the third
parameter (price) is mandatory, which indicates at which price level must the stop/limit order be
executed.
The developers can also use the methods ExitLong() and ExitShort() to close their positions
(using each one in the right case). In these methods, the only mandatory parameter is the order
type. The developer can also specify the price (required for Stop/Limit orders) and a label.
The next example code shows, using Simple Order Management, how to send a Buy signal at the current bar and:
- Place a Take Profit order when the price raises 50 points
- Place a Stop Loss order when the price falls 10 points
Visual Basic.NET
Public Overrides Sub OnNewBar()
    Buy(OrderType.Market, 1, 0, "Buying at the current price: " + Bars.Close(0))
    ExitLong(OrderType.Limit, Bars.Close(0) + 50, "Take Profit at " + (Bars.Close(0) + 50) + " points")
    ExitLong(OrderType.Stop, Bars.Close(0) - 10, "Stop Loss at " + (Bars.Close(0) - 10) + " points")
End Sub
C#
public override void OnNewBar()
{
    Buy(OrderType.Market, 1, 0, "Buying at the current price: " + Bars.Close[0]);
    ExitLong(OrderType.Limit, Bars.Close[0] + 50, "Take Profit at " + (Bars.Close[0] + 50) + " points");
    ExitLong(OrderType.Stop, Bars.Close[0] - 10, "Stop Loss at " + (Bars.Close[0] - 10) + " points");
}
In Simple Order Management, orders that are not filled are automatically cancelled after a bar close. Keep in mind to set the right orders for every new bar.
When using Advanced Order Management, the developer must create an Order object, which
may be an instance of MarketOrder, StopOrder or LimitOrder. Then, the order must be inserted
using the strategy method InsertOrder(). Orders can be linked using the IsChildOf property. An
order will be cancelled automatically when parent order is filled (or cancelled).
This behaviour allows the developer to store the orders in private objects inside the strategy (as
class attributes), modifying them when needed using the ModifyOrder() method.
The next example code shows, using Advanced Order Management, how to send a Buy signal at the current bar and place a Take Profit when the price raises 50 points and a Stop when the price falls 10 points. Then, if the position is long and the price has risen (compared to the previous bar), it raises the stop order sent previously.
Visual Basic.NET
Public Overrides Sub OnNewBar()
    If (GetOpenPosition() = 0) Then
        InsertOrder(New MarketOrder(OrderSide.Buy, 1, "Golden Cross - Open long position"))

        trailingStopOrder = New StopOrder(OrderSide.Sell, 1, Bars.Close(0) - 10, "Trailing Stop Level Hit - Close long position")
        InsertOrder(trailingStopOrder)

        takeProfitOrder = New LimitOrder(OrderSide.Sell, 1, Bars.Close(0) + 50, "Take Profit Level Hit - Close long position")
        InsertOrder(takeProfitOrder)

        takeProfitOrder.IsChildOf = trailingStopOrder
        trailingStopOrder.IsChildOf = takeProfitOrder
    Else
        If (Bars.Close(0) > Bars.Close(1)) Then
            trailingStopOrder.Price = trailingStopOrder.Price + (Bars.Close(0) - Bars.Close(1))
            ModifyOrder(trailingStopOrder)
        End If
    End If
End Sub
C#
public override void OnNewBar()
{
    if (GetOpenPosition() == 0)
    {
        InsertOrder(new MarketOrder(OrderSide.Buy, 1, "Golden Cross - Open long position"));

        trailingStopOrder = new StopOrder(OrderSide.Sell, 1, Bars.Close[0] - 10, "Trailing Stop Level Hit - Close long position");
        InsertOrder(trailingStopOrder);

        takeProfitOrder = new LimitOrder(OrderSide.Sell, 1, Bars.Close[0] + 50, "Take Profit Level Hit - Close long position");
        InsertOrder(takeProfitOrder);

        takeProfitOrder.IsChildOf = trailingStopOrder;
        trailingStopOrder.IsChildOf = takeProfitOrder;
    }
    else
    {
        if (Bars.Close[0] > Bars.Close[1])
        {
            trailingStopOrder.Price = trailingStopOrder.Price + (Bars.Close[0] - Bars.Close[1]);
            ModifyOrder(trailingStopOrder);
        }
    }
}
In Advanced Order Management, order duration is:
- GTC (good till cancelled): for non-intraday strategies
- DAY order: for intraday strategies (active orders are cleared at the end of the session)
Secondary charts
Although all event studies and strategies must be executed within a main chart, developers can program their algorithms using several secondary charts. These charts must be different from each other (a different contract and/or a different bar compression).
These secondary charts may be used to decide whether to operate at one bar or not, or to
check another product's bars (OHLC graphic), even adding indicators to these charts, but they
cannot be used to operate in (operations are only allowed on the main chart). Furthermore, the
strategy function OnNewBar() is only called everytime a new bar arrives to the main chart; at
this point, all the bars from the secondary charts prior to the current bar are already available.
The next code shows an example of creating a RSI Indicator for the main chart, and then another RSI Indicator for a chart using the product EuroFX with a bar compression of 15 minutes. If this chart is not specified during the execution of the backtest, it will be ignored.
Visual Basic.NET
Public Overrides Sub OnInitialize()
    rsiMain = New RSIIndicator(Bars.Close)
    AddIndicator("RSI Main", rsiMain)

    If (ContainsSecondaryChart("URO", BarPeriodType.Minute, 15)) Then
        Dim euroFX15min As Chart = GetSecondaryChart("URO", BarPeriodType.Minute, 15)
        rsiEuroFX = New RSIIndicator(euroFX15min.Bars.Close)
        euroFX15min.AddIndicator("RSI EuroFX", rsiEuroFX)
    End If
End Sub
C#
public override void OnInitialize()
{
    rsiMain = new RSIIndicator(Bars.Close);
    AddIndicator("RSI Main", rsiMain);

    if (ContainsSecondaryChart("URO", BarPeriodType.Minute, 15))
    {
        Chart euroFX15min = GetSecondaryChart("URO", BarPeriodType.Minute, 15);
        rsiEuroFX = new RSIIndicator(euroFX15min.Bars.Close);
        euroFX15min.AddIndicator("RSI EuroFX", rsiEuroFX);
    }
}
The next example code shows the using of the RSI EuroFX indicator, in case it is created.
Visual Basic.NET
Public Overrides Sub OnNewBar()
    If (GetOpenPosition() = 0 And rsiEuroFX IsNot Nothing) Then
        If (rsiEuroFX.GetRSI()(1) > 70 And rsiEuroFX.GetRSI()(0) <= 70) Then
            Sell(OrderType.Market, 1)
        ElseIf (rsiMain.GetRSI()(1) < 30 And rsiMain.GetRSI()(0) >= 30) Then
            Buy(OrderType.Market, 1)
        End If
    End If
End Sub
C#
public override void OnNewBar()
{
    if (GetOpenPosition() == 0 && rsiEuroFX != null)
    {
        if (rsiEuroFX.GetRSI()[1] > 70 && rsiEuroFX.GetRSI()[0] <= 70)
        {
            Sell(OrderType.Market, 1);
        }
        else if (rsiMain.GetRSI()[1] < 30 && rsiMain.GetRSI()[0] >= 30)
        {
            Buy(OrderType.Market, 1),
        }
    }
}
Using MarketDataTimeFrame
The Market Data Timeframe is an attribute for the class Chart. It indicates the timeframe (start time and end time) in which the application is expecting to receive bars.
Its default value is from 00:00:00 to 23:59:59, but it can be overriden. This can be particullary useful for calculating technical indicagors only on a session's subset, not on all the session bars. As all the bars outside the market data time frame will be ignored, indicators will not be calculated outside the specified market data time frame.
The next example code shows how the developer can define the market data timeframe between 08:00:00 and 14:00:00.
Visual Basic.NET
Public Overrides Sub OnInitialize()
    MarketDataTimeFrame = New TimeFrame(New TimeSpan(8, 0, 0), New TimeSpan(14, 0, 0))
End Sub
C#
public override void OnInitialize()
{
    MarketDataTimeFrame = new TimeFrame(new TimeSpan(8, 0, 0), new TimeSpan(14, 0, 0));
}
Using TradingTimeFrame
The TradingTimeFrame attribute belongs to the class Strategy. It indicates the timeframe when orders are allowed to be executed, acting as a security filter.
Any order executed within the timeframe will go as usual. However, an order executed outside the timeframe will throw an InvalidOperationException.
The next example code shows how the developer can define the trading timeframe. Plus, this code would throw an exception when the first bar with time 15:00:00 would arrive, as we have defined that the strategy is allowed to trade only between 08:00:00 and 14:00:00.
Visual Basic.NET
Public Overrides Sub OnInitialize()
    TradingTimeFrame = New TimeFrame(New TimeSpan(8, 0, 0), New TimeSpan(14, 0, 0))
End Sub

Public Overrides Sub OnNewBar()
    If (GetOpenPosition() = 0) Then
        If (Bars.Time(0).TimeOfDay >= New TimeSpan(15, 0, 0)) Then
            Buy(OrderType.Market, 1)
        End If
    End If
End Sub
C#
public override void OnInitialize()
{
    TradingTimeFrame = new TimeFrame(new TimeSpan(8, 0, 0), new TimeSpan(14, 0, 0));
}

public override void OnNewBar()
{
    if (GetOpenPosition() == 0)
    {
        if (Bars.Time[0].TimeOfDay >= new TimeSpan(15, 0, 0))
        {
            Buy(OrderType.Market, 1);
        }
    }
}
Using MaxOpenPosition
The strategy attribute MaxOpenPosition indicates the maximum amount of open contracts at a time. It is a security filter that ensures a strategy will never exceed its maximum open positions limit.
If a strategy tries to open more positions than this attribute indicates, the runner will throw an InvalidOperationException.
The next example code shows how to set this attribute (with a test value of 3).
Visual Basic.NET
Public Overrides ReadOnly Property MaxOpenPosition As UInteger
    Get
        Return 3
    End Get
End Property
C#
public override uint MaxOpenPosition
{
    get { return 3; }
}
Following this example, the next code would throw an exception on the fourth bar that arrives (because it would already have 3 open positions, and we are not controlling the current open position).
Visual Basic.NET
Public Overrides Sub OnNewBar()
    Buy(OrderType.Market, 1)
End Sub
C#
public override void OnNewBar()
{
    Buy(OrderType.Market, 1);
}
The next example code would also throw an exception, as it tries to open 5 positions at the same operation, when the maximum allowed is 3.
Visual Basic.NET
Public Overrides Sub OnNewBar()
    Buy(OrderType.Market, 5)
End Sub
C#
public override void OnNewBar()
{
    Buy(OrderType.Market, 5);
}
Using ForceClosingIntradayPosition and IntradayClosingBar
The attributes ForceClosingIntradayPosition and IntradayClosingBar both belong to the class Strategy.
The first one indicates whether the strategy is intraday or not: that means whether there might be open positions by the end of the day or not.
The second attribute is only used when strategy is marked as intraday, and indicates, starting at the end, the number of bar in which the day will be considered over (closing any open position it might have). Its default value is 0. For example, if we want our strategy consider the end of the day at the prior to last bar, we would set ForceClosingIntradayPosition to true and IntradayClosingBar to 1.
After this bar, the strategy won't receive any OnNewBar() event until next session.
Indicators visualization options
Indicators have two attributes that manage their visualization options when they are shown on the OHLC chart. These attributes are ShownInChart and ShownOverInputSeries, and can be overridden by the developer.
ShownInChart indicates whether the indicator is drawn on the OHLC graphic or not. Its default value is true. If its value is false, it will not be drawn, although it's calculated and can be accessed as usual.
ShownOverInputSeries is true when the indicator must be drawn on the same graphic area as its input series (for example, if an indicator takes as input series the Close serie from the Bars object and has this attribute set to true, this indicator would be drawn on the same area as the candlestick bars). Its default value is false.
The next example image shows two indicators: a RSI with input series the Close prices, which is drawn on a separate area (ShowOverInputSeries = false); and a SMA with input series the previous RSI indicator output, with the attribute ShownOverInputSeries set to true.
The code used for this example is as follows.
Visual Basic.NET
Public Overrides Sub OnInitialize()
    Dim rsi As RSIIndicator = New RSIIndicator(Bars.Close, 12)
    rsi.ShownInChart = True
    rsi.ShownOverInputSeries = False

    Dim sma As SMAIndicator = New SMAIndicator(rsi.GetRSI(), 4)
    sma.ShownInChart = True
    sma.ShownOverInputSeries = True

    AddIndicator("RSI Indicator", rsi)
    AddIndicator("SMA Indicator", sma)
End Sub
C#
public override void OnInitialize()
{
    RSIIndicator rsi = new RSIIndicator(Bars.Close, 13);
    rsi.ShownInChart = true;
    rsi.ShownOverInputSeries = false;

    SMAIndicator sma = new SMAIndicator(rsi.GetRSI(), 4);
    sma.ShownInChart = true;
    sma.ShownOverInputSeries = true;

    AddIndicator("RSI Indicator", rsi);
    AddIndicator("SMA Indicator", sma);
}
Live Execution
Data Feed
For both backtesting and real-time execution, SDK platform uses non-adjusted, continuous intraday bar data.
In real-time mode SDK platform uses market tick-data for tracking limit/stop active orders execution. This tick data is used internally, and is not available for strategy developers.
Rollovers
SDK platform manages automatically the rollover of strategies running live.
Summary of the rollover rules we use for continuous intraday continuous symbols:
- European Index Futures: Switch to new expiry at the beginning of expiry date (if expiry of is March 21th, the chart in the 20th will show March and on the 21st will show the new expiry April or June).
- US Index Futures: Switch to new expiry at the beginning of the Thursday on the week before the expiry date (if expiry is on Fri March 21st, the continuous contract will display March until the 12th, and June starting on the 13th).
- Currency Futures: Switch to new expiry at the beginning of the Thursday on the week before the expiry date (if expiry is on Mon March 17st, the continuous contract will display March until the 12th, and June starting on the 13th).
- Energy Futures: Switch to new expiry at the beginning of the Last Trading Day
Order execution prices
For market orders we use the open price of next bar with one exception: the automatic closing of any open position for intraday strategies. In this case, we close the position with Bars.Close[0] in backtest mode. While running live, we close automatically any open position a couple of minutes before session's ending.
For limit/stop orders we always use the hypothetic execution prices, and we measure/track the slippage for all trades placed on real client's accounts.
Appendix I - Technical Indicators
Overlap Studies
Namespace: TradingMotion.SDK.Markets.Indicators.OverlapStudies
| Name | Class Name | Info link |
|---|---|---|
| Bollinger Bands | BBandsIndicator | + info |
| Double Exponential Moving Average | DEMAIndicator | + info |
| Exponential Moving Average | EMAIndicator | + info |
| Hilbert Transform - Instantaneous Trendline | HTTrendlineIndicator | + info |
| Kaufman Adaptive Moving Average | KAMAIndicator | + info |
| Moving Average | MovingAverageIndicator | + info |
| MESA Adaptive Moving Average | MAMAIndicator | + info |
| Moving average with variable period | MovingAverageVariablePeriodIndicator | + info |
| MidPoint over period | MidPointIndicator | + info |
| MidPoint price over period | MidPriceIndicator | + info |
| Parabolic SAR | SARIndicator | + info |
| Parabolic SAR - Extended | SARExtIndicator | + info |
| Simple Moving Average | SMAIndicator | + info |
| Triple Exponential Moving Average | T3Indicator | + info |
| Triangular Moving Average | TriMAIndicator | + info |
| Weighted Moving Average | WMAIndicator | + info |
Volatility Indicators
Namespace: TradingMotion.SDK.Markets.Indicators.Volatility
| Name | Class Name | Info link |
|---|---|---|
| Average True Range | ATRIndicator | + info |
| Normalized Average True Range | NATRIndicator | + info |
| True Range | TrueRangeIndicator | + info |
Momentum Indicators
Namespace: TradingMotion.SDK.Markets.Indicators.Momentum
| Name | Class Name | Info link |
|---|---|---|
| Average Directional Movement Index | ADXIndicator | + info |
| Average Directional Movement Index Rating | ADXRIndicator | + info |
| Absolute Price Oscillator | APOIndicator | + info |
| Aroon | AroonIndicator | + info |
| Aroon Oscillator | AroonOscIndicator | + info |
| Balance of Power | BOPIndicator | + info |
| Commodity Channel Index | CCIIndicator | + info |
| Moving Average Convergence/Divergence | MACDIndicator | + info |
| MACD with controllable MA type | MACDExtIndicator | + info |
| MACD Fix 12/26 | MACDFixIndicator | + info |
| Money Flow Index | MFIIndicator | + info |
| Minus Directional Indicator | MinusDIIndicator | + info |
| Minus Directional Movement | MinusDMIIndicator | + info |
| Momentum | MomentumIndicator | + info |
| Plus Directional Indicator | PlusDIIndicator | + info |
| Plus Directional Movement | PlusDMIIndicator | + info |
| Percentage Price Oscillator | PPOIndicator | + info |
| Rate of change: ((price/prevPrice)-1)*100 | ROCIndicator | + info |
| Rate of change percentage: (price-prevPrice)/prevPrice | ROCPIndicator | + info |
| Rate of change ratio: price/prevPrice | ROCRIndicator | + info |
| Rate of change ratio 100 scale: (price/prevPrice)*100 | ROCR100Indicator | + info |
| Relative Strength Index | RSIIndicator | + info |
| Stochastic | StochasticIndicator | + info |
| Stochastic Fast | StochasticFastIndicator | + info |
| Stochastic Relative Strength Index | StochasticRSIIndicator | + info |
| 1-day Rate-of-Change (ROC of a Triple Smooth EMA | TRIXIndicator |
+ info + info |
| Ultimate Oscillator | UltOscIndicator | + info |
| Williams' %R | WilliamsRIndicator | + info |
Cycle Indicators
Namespace: TradingMotion.SDK.Markets.Indicators.Cycle
| Name | Class Name | Info link |
|---|---|---|
| Hilbert Transform - Dominant Cycle Period | HTDCPeriodIndicator | + info |
| Hilbert Transform - Dominant Cycle Phase | HTDCPhaseIndicator | + info |
| Hilbert Transform - SineWave | HTSineIndicator | + info |
| Hilbert Transform - Trend vs. Cycle Mode | HTTrendModeIndicator | - |
Volume Indicators
Namespace: TradingMotion.SDK.Markets.Indicators.Volume
| Name | Class Name | Info link |
|---|---|---|
| Chaikin A/D Line | ChaikinADLineIndicator | + info |
| Chaikin A/D Oscillator | ChaikinADOscIndicator | + info |
| On Balance Volume | OBVIndicator | + info |
Pattern Recognition
Namespace: TradingMotion.SDK.Markets.Indicators.Patterns
| Name | Class Name | Info link |
|---|---|---|
| Abandoned Baby | AbandonedBabyIndicator | + info |
| Advance Block | AdvanceBlockIndicator | + info |
| Belt-Hold | BeltHoldIndicator | + info |
| Breakaway | BreakawayIndicator | + info |
| Closing Marubozu | ClosingMarubozuIndicator | + info |
| Concealing Baby Swallow | ConcealingBabySwallowIndicator | + info |
| Counterattack | CounterAttackIndicator | + info |
| Dark Cloud Cover | DarkCloudCoverIndicator | + info |
| Doji | DojiIndicator | + info |
| Doji Star | DojiStarIndicator | + info |
| Dragonfly Doji | DragonflyDojiIndicator | + info |
| Engulfing Pattern | EngulfingPatternIndicator | + info |
| Evening Doji Star | EveningDojiStarIndicator | + info |
| Evening Star | EveningStarIndicator | + info |
| Up/Down-gap side-by-side withe lines | GapSideBySideWhiteIndicator |
+ info + info |
| Gravestone Doji | GravestoneDojiIndicator | + info |
| Hammer | HammerIndicator | + info |
| Hanging Man | HangingManIndicator | + info |
| Harami Pattern | HaramiPatternIndicator | + info |
| Harami Cross Pattern | HaramiCrossPatternIndicator | + info |
| High-Wave Candle | HighWaveCandleIndicator | + info |
| Hikkake Pattern | HikkakePatternIndicator | + info |
| Modified Hikkake Pattern | ModifiedHikkakePatternIndicator | + info |
| Homing Pigeon | HomingPigeonIndicator | + info |
| Identical Three Crows | IdenticalThreeCrowsIndicator | + info |
| In-Neck Pattern | InNeckPatternIndicator | + info |
| Inverted Hammer | InvertedHammerIndicator | + info |
| Kicking | KickingIndicator | + info |
| Kicking - bull/bear determined by the longer marubozu | KickingByLengthIndicator | + info |
| Ladder Bottom | LadderBottomIndicator | + info |
| Long Legged Doji | LongLeggedDojiIndicator | + info |
| Long Line Candle | LongLineCandleIndicator | + info |
| Marubozu | MarubozuIndicator | + info |
| Matching Low | MatchingLowIndicator | + info |
| Mat Hold | MatHoldIndicator | + info |
| Morning Doji Star | MorningDojiStarIndicator | + info |
| Morning Star | MorningStarIndicator | + info |
| On-Neck Pattern | OnNeckPatternIndicator | + info |
| Piercing Pattern | PiercingPatternIndicator | + info |
| Rickshaw Man | RickshawManIndicator | + info |
| Rising/Falling Three Methods | RiseFallThreeMethodsIndicator | + info |
| Separating Lines | SeparatingLinesIndicator |
+ info + info |
| Shooting Star | ShootingStarIndicator | + info |
| Short Line Candle | ShortLineCandleIndicator | + info |
| Spinning Top | SpinningTopIndicator | + info |
| Stalled Pattern | StalledPatternIndicator | + info |
| Stick Sandwich | StickSandwichIndicator | + info |
| Takuri (Dragonfly Doji with very long lower shadow) | TakuriIndicator | + info |
| Tasuki Gap | TasukiGapIndicator |
+ info + info |
| Two Crows | TwoCrowsIndicator | + info |
| Three Black Crows | ThreeBlackCrowsIndicator | + info |
| Three Inside Up/Down | ThreeInsideUpDownIndicator | + info |
| Three-Line Strike | ThreeLineStrikeIndicator | + info |
| Three Outside Up/Down | ThreeOutsideUpDownIndicator | + info |
| Three Stars In The South | ThreeStarsInTheSouthIndicator | + info |
| Three Advancing White Soldiers | ThreeAdvancingWhiteSoldiersIndicator | + info |
| Thrusting Pattern | ThrustingPatternIndicator | + info |
| Tristar Pattern | TriStarPatternIndicator | + info |
| Unique 3 River | UniqueThreeRiverIndicator | + info |
| Upside Gap Two Crows | UpsideGapTwoCrowsIndicator | + info |
| Upside/Downside Gap Three Methods | UpDownGapThreeMethodsIndicator | + info |
Statistic Functions
Namespace: TradingMotion.SDK.Markets.Indicators.StatisticFunctions
| Name | Class Name | Info link |
|---|---|---|
| Linear Regression | LinearRegressionIndicator | + info |
| Linear Regression Angle | LinearRegressionAngleIndicator | + info |
| Linear Regression Intercept | LinearRegressionInterceptIndicator | + info |
| Linear Regression Slope | LinearRegressionSlopeIndicator | + info |
| Standard Deviation | StdDevIndicator | + info |
| Time Series Forecast | TimeSeriesForecastIndicator | + info |
| Variance | VarianceIndicator | + info |
Price Transform
Namespace: TradingMotion.SDK.Markets.Indicators.PriceTransform
| Name | Class Name | Info link |
|---|---|---|
| Average Price | AveragePriceIndicator | + info |
| Median Price | MedianPriceIndicator | + info |
| Typical Price | TypicalPriceIndicator | + info |
| Weighted Close Price | WCLPriceIndicator | + info |
Appendix II - Available Products
| Product ID | Name | Market | Currency | Point Value | Tick Size |
|---|---|---|---|---|---|
| NQ | E-mini Nasdaq | CME | USD | 20 | 0,25 |
| ES | E-mini S&P | CME | USD | 50 | 0,25 |
| FDAX | DAX | EUREX | EUR | 25 | 1 |
| GC | Gold | CME-COMEX | USD | 100 | 0,1 |
| YM | E-mini DowJones | CME | USD | 5 | 1 |
| RTY | Mini-Russell CME | CME | USD | 50 | 0,1 |
| CL | Crude Oil | CME-NYMEX | USD | 1000 | 0,01 |
| FDXM | Mini-Dax | EUREX | EUR | 5 | 1 |
| DM | S&P MidCap | CME | USD | 100 | 0,1 |
| URO | EuroFX | CME | USD | 125000 | 0,00005 |
| SI | Silver | CME-COMEX | USD | 5000 | 0,005 |
| RB | RBOB Gasoline | CME-NYMEX | USD | 42000 | 0,0001 |
| IFS | FTSE MIB | IDEM | EUR | 5 | 5 |
| IX | IBEX | MEFF | EUR | 10 | 1 |
| HO | Heating Oil | CME-NYMEX | USD | 42000 | 0,0001 |
| QM | E-mini Crude Oil | CME-NYMEX | USD | 500 | 0,025 |
| FGBL | BUND | EUREX | EUR | 1000 | 0,01 |
| HG | Copper | CME-COMEX | USD | 25000 | 0,0005 |
| ZB | 30y T-Bond | CME-CBOT | USD | 1000 | 0,03125 |
| NG | Natural Gas | CME-NYMEX | USD | 10000 | 0,001 |
| PL | Platinum | CME-COMEX | USD | 50 | 0,1 |
| NKD | Nikkei USD | CME | USD | 5 | 5 |
| FCE | CAC | EURONEXT | EUR | 10 | 0,5 |
| ZS | Soybeans | CME-CBOT | USD | 50 | 0,25 |
| FESX | EuroStoxx | EUREX | EUR | 10 | 1 |
| ZW | Wheat | CME-CBOT | USD | 50 | 0,25 |
| HE | Lean Hogs | CME-CBOT | USD | 400 | 0,025 |
| BP | British Pound | CME | USD | 62500 | 0,0001 |
| MN | Mini-Ibex | MEFF | EUR | 1 | 5 |
| LE | Live Cattle | CME-CBOT | USD | 400 | 0,025 |
| AEX | AEX | EURONEXT | EUR | 200 | 0,05 |
| IFM | Mini FTSE MIB | IDEM | EUR | 1 | 5 |
| SF | Swiss Franc | CME | USD | 125000 | 0,0001 |
| ZC | Corn | CME-CBOT | USD | 50 | 0,25 |
| ZN | 10y T-Note | CME-CBOT | USD | 1000 | 0,015625 |
| SB11 | ICE Sugar #11 | ICE-US | USD | 1120 | 0,01 |
We support all futures products from CME Group®, ICE®, EUREX® and EURONEXT® exchanges.
Contact us at sdk@tradingmotion.com for more information about other products.


